2026 Performance Management Report
Post content
Zac Upchurch
Talent Strategy Group
Welcome to the 2026 Performance Management Report, providing a data-driven view of how organizations design, manage, and execute Performance Management today. Drawing on data from more than 250 organizations across industries, sizes, and geographies, this report examines the design choices and perceived effectiveness of Performance Management processes.
This year’s report reveals interesting – and in some cases counterintuitive – insights about Performance Management. While the process has reached near-universal adoption, perceived effectiveness varies widely.
Key Findings Include:
- Performance Management Is Nearly Universally Adopted: More than nine out of ten organizations report having a Performance Management process in place.
- Simplicity Outperforms Complexity: Organizations operating a single, enterprise-wide Performance Management process report consistently higher perceived effectiveness and participant capability than those operating multiple processes.
- Process Structure and Clarity Correlate with Stronger Results: Structured goal cascades, defined performance distributions, performance calibrations, and explicit pay-for-performance linkages are consistently associated with stronger perceived outcomes.
- Execution Gaps Undermine Process Intent: Organizations commonly encourage frequent feedback, yet actual feedback conversations fall short of guidance. Similarly, employees tend to exceed their organization’s guidance on both the number of goals set and the time required to finalize goals. In each case, misalignment between process intent and execution correlates with weaker outcomes.
- Organizations Underinvest in Capability Building: Mandatory training on goal setting, feedback, and reviewing is strongly associated with higher perceived effectiveness and participant capability, yet is uncommon.
- Artificial Intelligence (AI) Is Largely Experimental: AI adoption in Performance Management is nascent and primarily experimental.
I would like to thank the organizations that contributed data to this research. I look forward to continuing to work with organizations as they seek to use Performance Management as a core vehicle for performance differentiation and value creation.
Zac Upchurch
Chief Operating Officer, The Talent Strategy Group
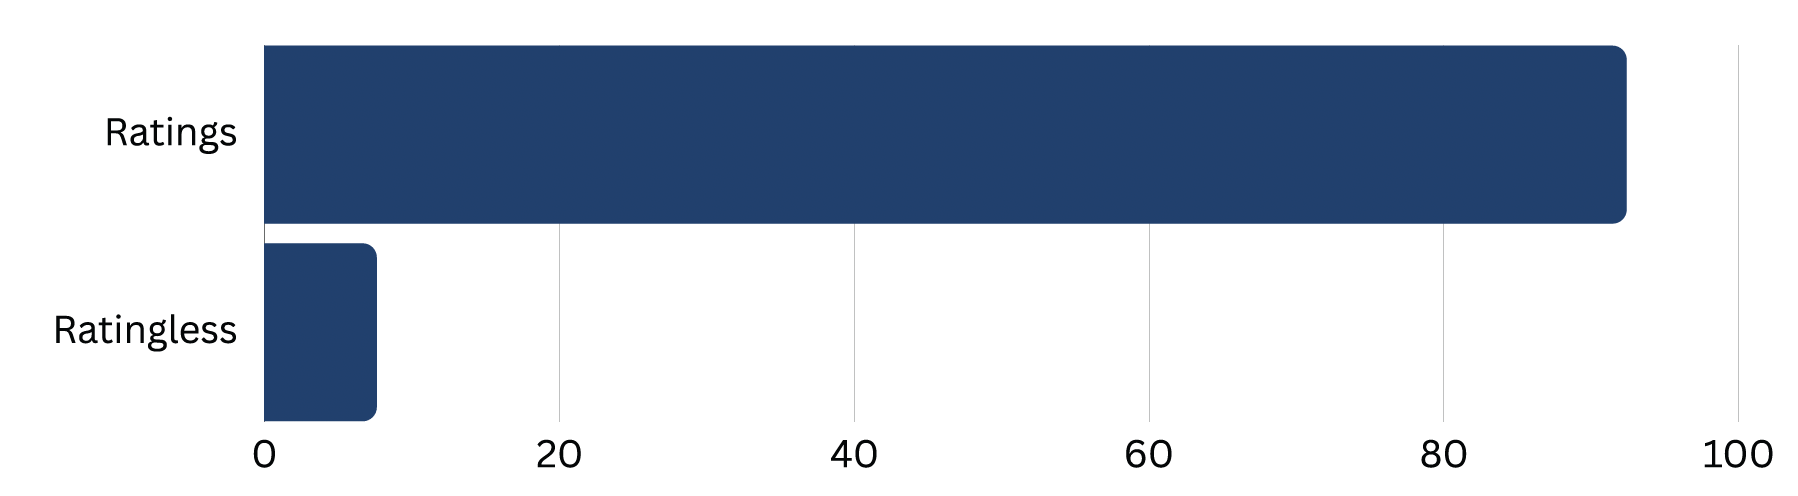
Performance Management Is Nearly Universally Adopted
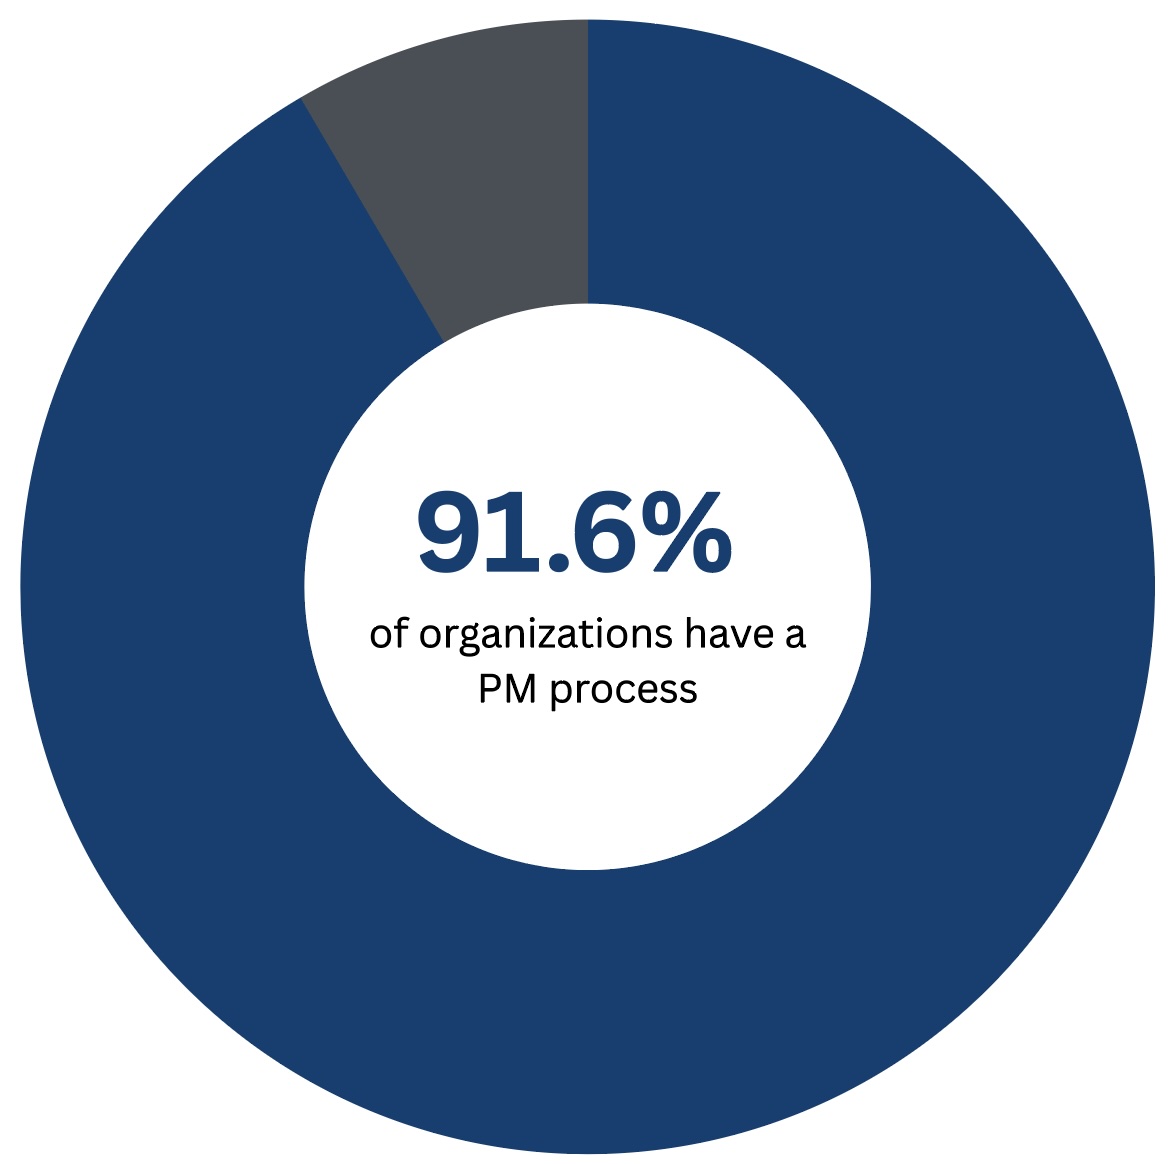
Performance Management has reached widespread adoption across organizations, particularly among large and complex companies. The vast majority (91.6%) of organizations report having a formal Performance Management process in place, while only 8.4% report that they do not currently have the process in place.
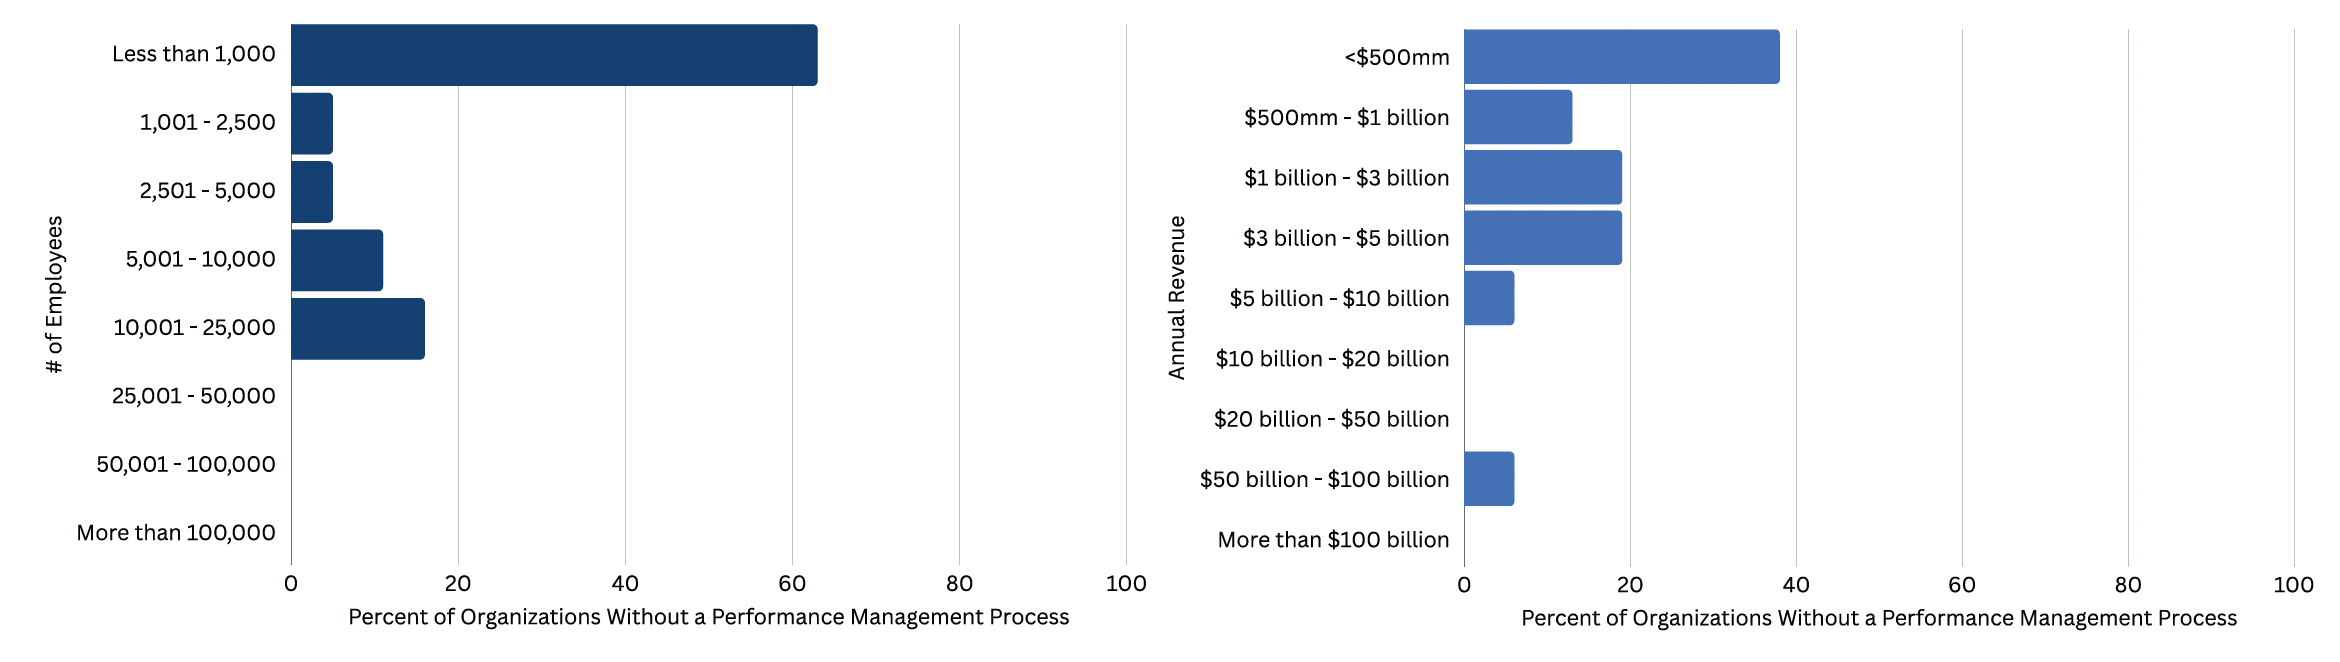
Organizations without a Performance Management process skew meaningfully smaller. Nearly two-thirds (63.2%) of organizations without a process have fewer than 1,000 employees, and half report annual revenues below $1 billion. Said differently, Performance Management is nearly universally adopted, where the absence of the process is largely a feature of the organization’s size.
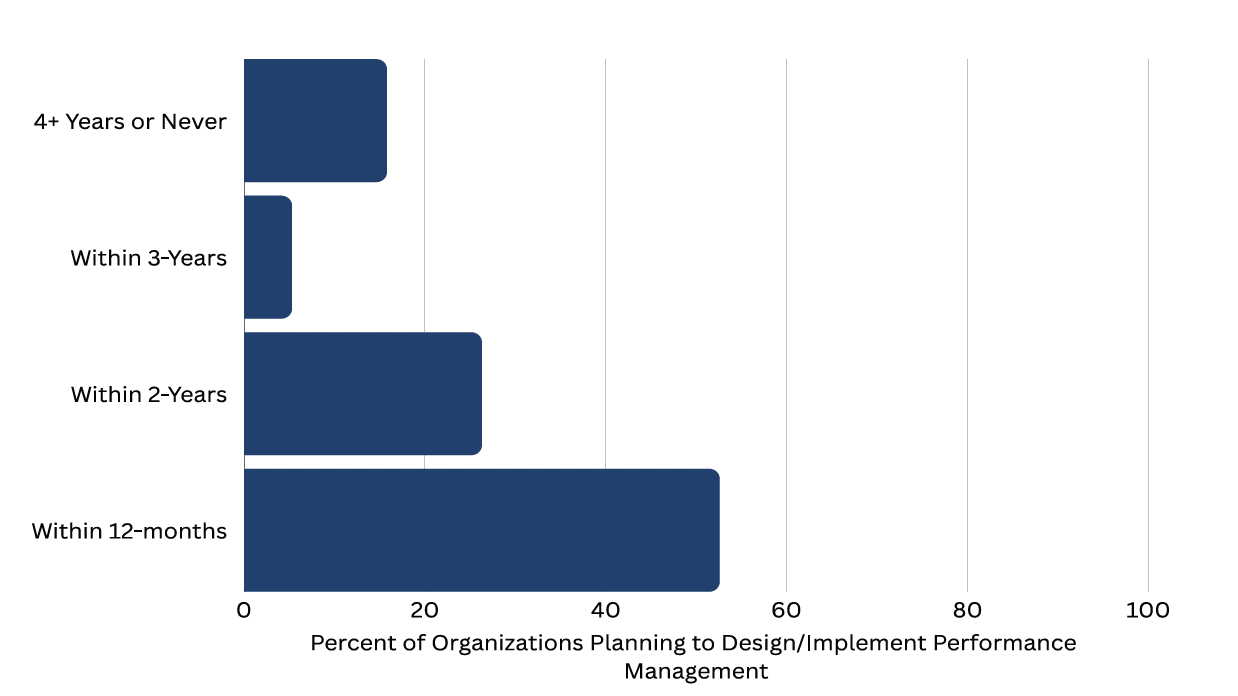
Generally, organizations without a Performance Management process aspire to implement the process in the next few years. More than four out of five (84.2%) organizations without a Performance Management process intend to design and implement the process within the next three years. Only three organizations surveyed do not have a Performance Management process and do not plan to implement one within the next four or more years.
Key Takeaways:
- Performance Management is effectively universal among large organizations, not a differentiator in itself.
- The absence of a Performance Management process appears to reflect organizational scale rather than philosophical opposition.
- For organizations without a Performance Management process, the strategic question is not whether they will implement the process, but when and how to design and execute it.
A Single Performance Management Process Is Most Prevalent
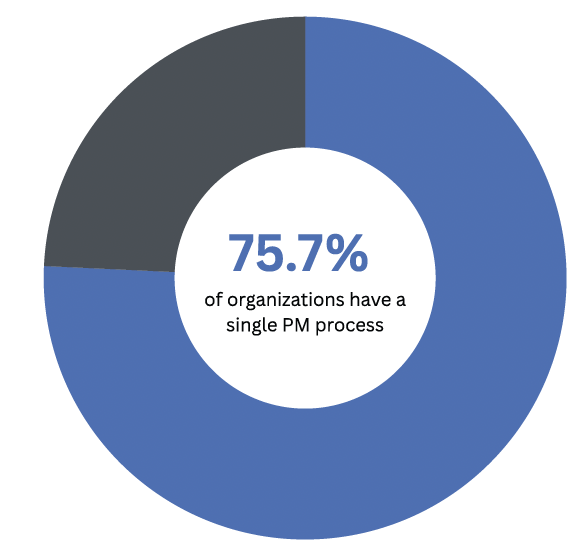
Three out of four organizations (75.7%) report operating a single Performance Management process that applies to all full-time employees. The remaining 24.3% of organizations operate two or more distinct Performance Management processes.
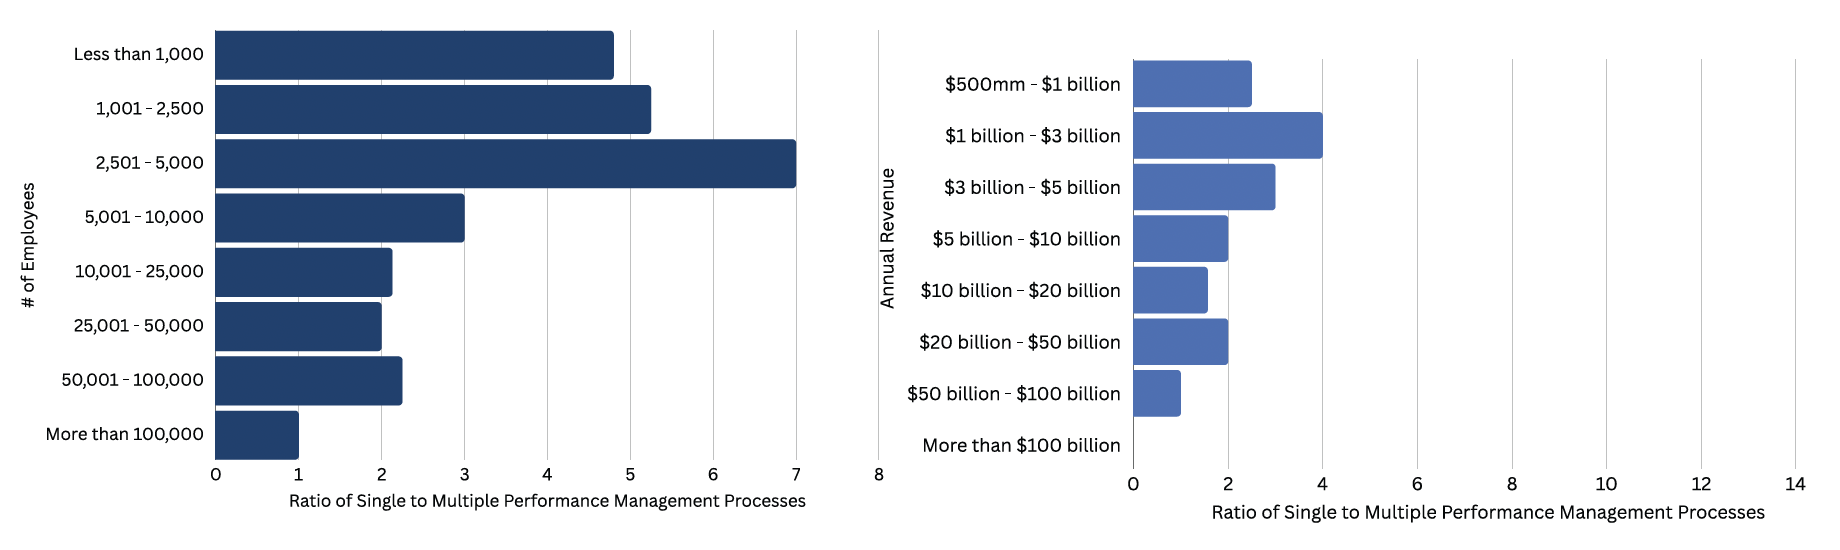
Organizational size is a key driver of this distinction. Smaller organizations – as measured by both employee count and annual revenue – are significantly more likely to operate a single process. As organizational size and complexity increase, the likelihood of operating multiple Performance Management processes increases as well.
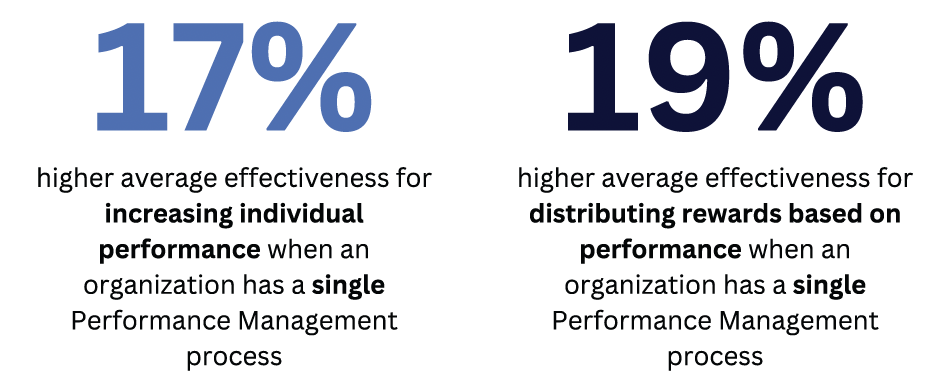
Notably, organizations with a single Performance Management process report meaningfully higher perceived effectiveness and participant capability across every outcome measured. Compared to organizations with multiple processes, organizations with a single process report:
- 17% higher perceived effectiveness in increasing individual performance
- 14% higher perceived effectiveness in goal alignment
- 8% higher perceived effectiveness in feedback and coaching
- 14% higher perceived effectiveness in assessing performance
- 19% higher perceived effectiveness in distributing compensation based on performance
These findings represent correlations rather than causal conclusions. Nonetheless, the consistency of the results across every outcome measured and across organizational sizes suggests that a single process may carry meaningful benefits.
When organizations operate multiple Performance Management processes, the most frequently cited reasons include:
- The need to define a different process for hourly, frontline, production, or operations employees
- Separate processes for unionized employees
- Sales compensation plans operating independently of Performance Management
- Works council agreements requiring different and/or modified processes by geography
- Distinct processes for managers versus non-managers
While these needs are often driven by legitimate operational or regulatory requirements, they introduce process fragmentation that can reduce consistency, clarity, and perceived effectiveness.
Key Takeaways:
- Organizations operating a single Performance Management process report stronger perceived outcomes than those managing multiple processes.
- Multiple processes often emerge for operational or regulatory reasons but introduce consistency and clarity risks.
- Absent a compelling constraint, HR should treat process simplicity as a default and add complexity only where required.
Performance Management Undergoes Frequent Redesign
Over the past decade, organizations have repeatedly redesigned their Performance Management processes in response to shifting philosophies, regulatory considerations, and technology enablement. A notable impetus of process redesign included the rise of ratingless Performance Management processes and a broader push toward simplification.
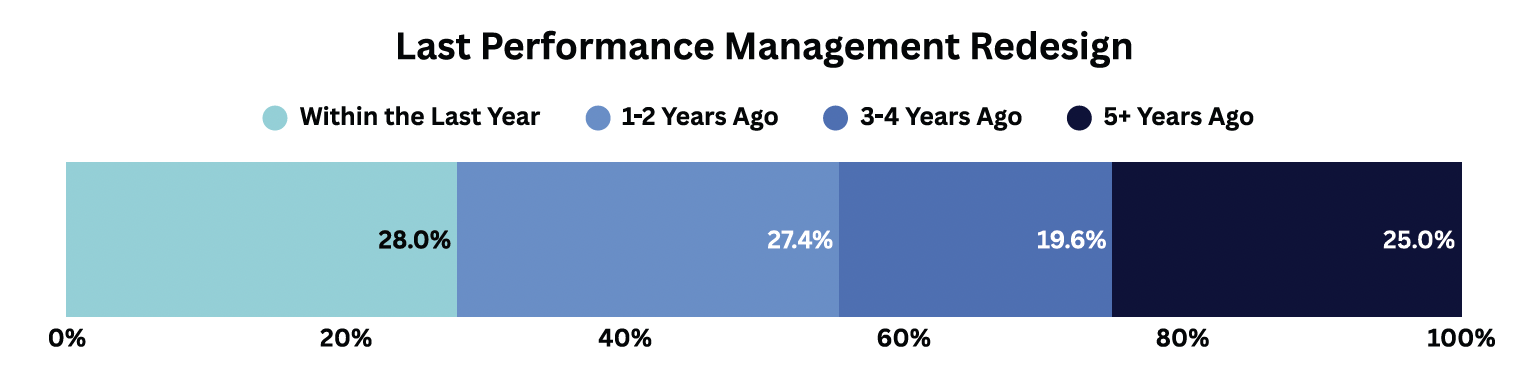
As a result, redesign of Performance Management is frequent. Among organizations with a Performance Management process:
- 55.4% last redesigned their process within the past two years
- 25% have maintained a stable process for five or more years
Notably, there are no material differences in perceived process effectiveness or participant capability based on when the process was last redesigned, meaning a process redesigned in the previous 12 months isn’t correlated to higher perceived effectiveness or participant capability as compared to a process redesigned 5+ years ago. These findings underscore the degree of experimentation occurring within the Performance Management domain and suggest that while redesigns may reflect responsiveness to internal or external pressures, they also carry change management costs and can contribute to participant change fatigue and lost process credibility if undertaken too frequently. A good starting point if contemplating a process redesign is to answer, “What outcomes do we expect to achieve that are meaningfully different than what the process delivers today?” and then managing the redesign to yield the intended outcomes.
Key Takeaways:
- Performance Management undergoes substantial redesign with most organizations having redesigned their process within the last 2-years.
- Process redesigns aren’t correlated to increases in perceived effectiveness nor participant capability.
- Too frequently redesigning Performance Management can decrease its credibility and result in unnecessary change fatigue and capability reset.
Goal Setting Is a Ubiquitous and Critical Process Element
Goal setting is nearly universally present within Performance Management processes. Nine out of ten organizations (91.1%) include a goal setting component as part of their Performance Management process.
Among organizations with goal setting:
- 84.8% facilitate goal setting once per year
- 6.6% facilitate goal setting twice per year
- 6.6% facilitate goal setting more than twice per year
- 2.0% facilitate goal setting less frequently than annually
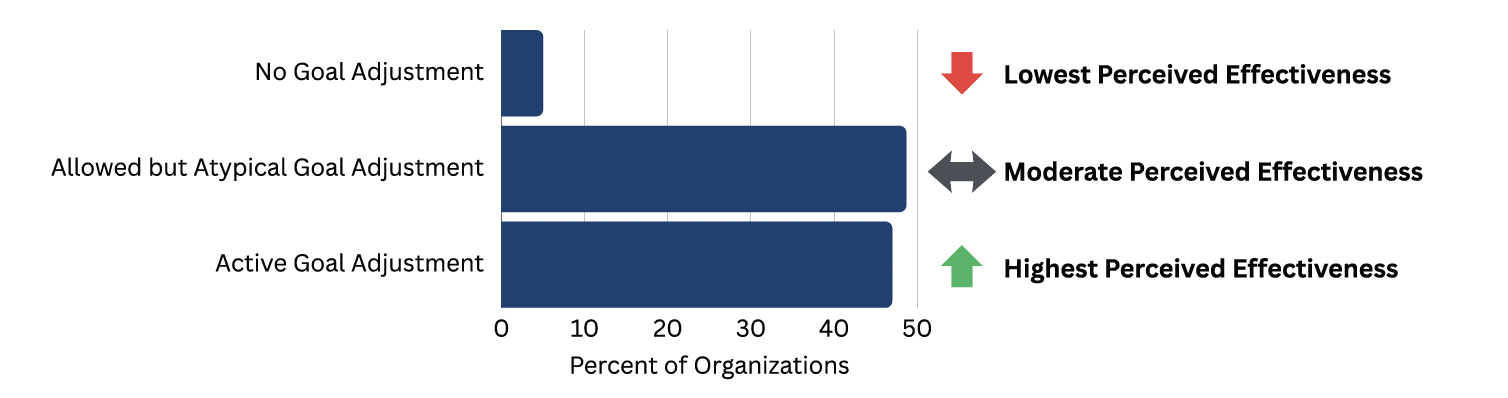
Regardless of goal setting frequency, ongoing goal monitoring and adjustment are common. Only 4.7% of organizations do not allow goals to be adjusted during the Performance Management cycle. Nearly half (48.7%) allow adjustments but report that changes are atypical, while 46.7% actively encourage ongoing monitoring and adjustment.
Organizations that actively monitor goals and allow adjustments report the highest levels of perceived Performance Management effectiveness and participant capability. Conversely, prohibiting goal adjustments is associated with lower perceived effectiveness and capability.
Key Takeaways:
- Goal setting is foundational across Performance Management processes.
- Static goal setting appears increasingly misaligned with dynamic business environments, as organizations that allow monitoring and adjustment report stronger perceived outcomes.
- Leaders should view goal setting not as a one-time compliance activity, but as an ongoing alignment mechanism requiring reinforcement throughout the process cycle.
Goal Cascades Increase Goal Alignment and Stretch
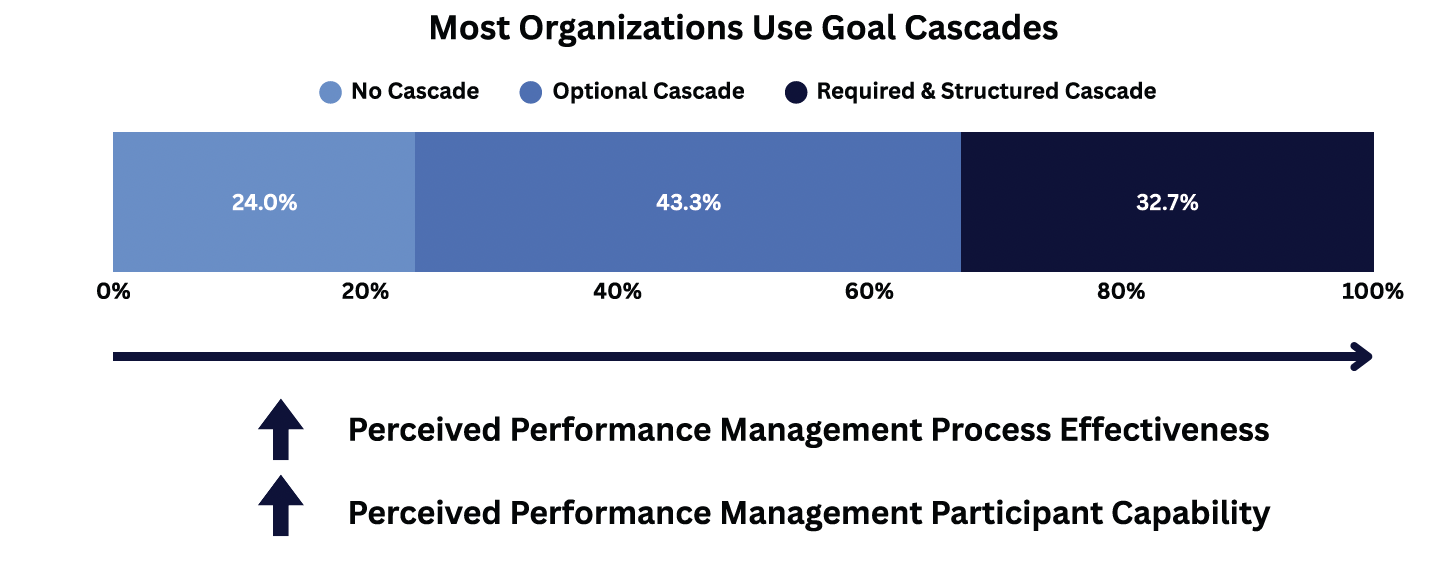
Formal goal cascades are common. Three out of four organizations (76.0%) utilize a goal cascade process to align individual goals with the organization’s goals. Among those organizations with a goal cascade:
- 43% require a structured, level-based cascade
- 57% recommend a cascade but allow flexibility in how the cascade occurs
More structured and mandatory cascade processes are associated with higher perceived Performance Management process effectiveness and participant capability, suggesting that clarity and alignment outweigh the perceived rigidity of formal cascades.
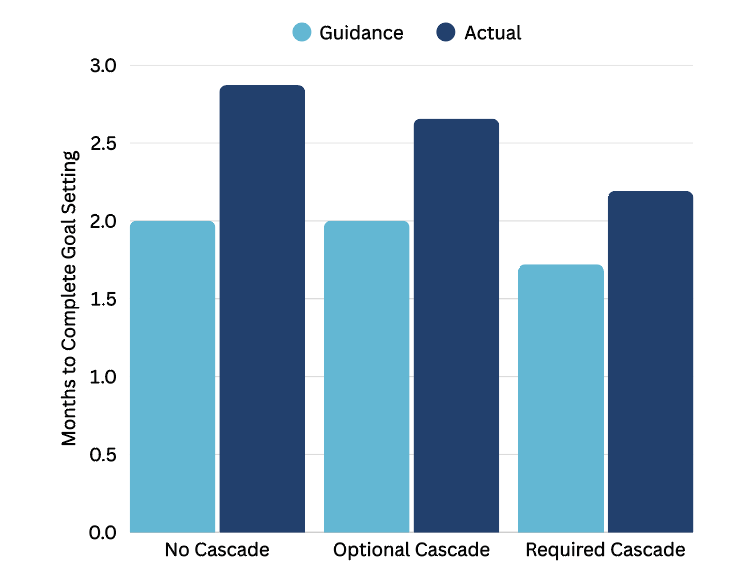
A common concern with recommended or mandatory goal cascades is that they extend the goal setting process timeline. However, the data do not support this claim. There are no meaningful differences in the time required to complete goal setting based on whether a goal cascade exists or how forceful the cascade is structured. In fact, organizations with a mandatory, structured goal cascade report the shortest average goal setting timelines in practice. Moreover, as the goal cascade process becomes more mandatory and structured, the gap between guided and actual goal setting completion timelines narrows – suggesting that structured cascades can reduce variability and improve predictability of the goal setting timeline without extending the overall duration.
Key Takeaways:
- Goal cascades are common and are associated with stronger perceived goal alignment and effectiveness.
- More structured goal cascades do not appear to lengthen goal setting timelines and may reduce variability and unpredictability.
- Given the absence of evident downside and the presence of alignment benefits, structured goal cascades represent a defensible design choice for Performance Management processes.
Employees Are Guided to Set SMART/SIMple Goals Without Goal Weights
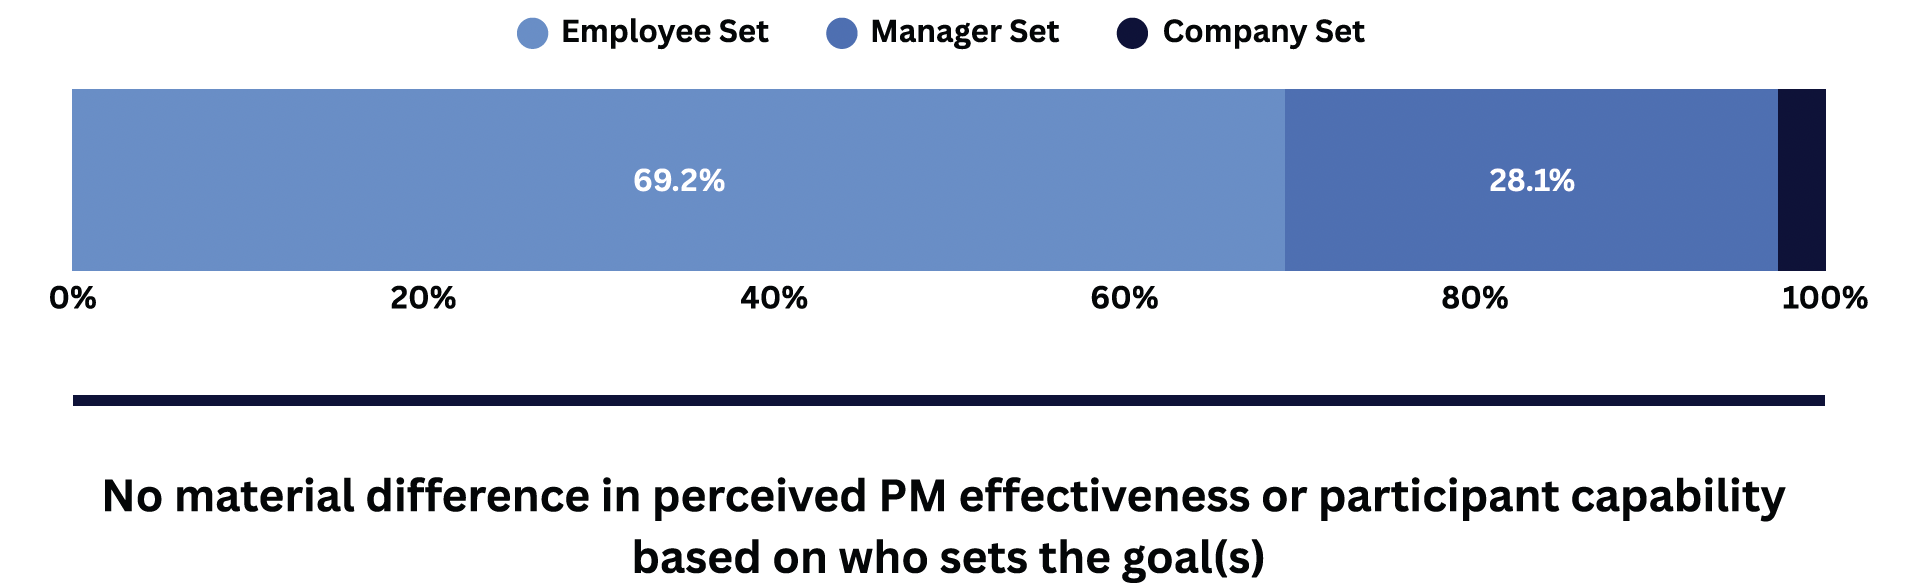
The responsibility for setting goals most often sits with the employee (69.2%), while 28.1% place the responsibility on the manager to set goals for their direct report. A small minority of organizations (2.7%) automatically assign all employees goals, based on standardized goal assignments. There is no material difference in perceived Performance Management process effectiveness or participant capability based on whether goals are set by employees or managers.
Irrespective of who sets the goal, ensuring the goal is high quality is critical to the goal’s efficacy. For example, organizations that have their employees set their own goals need to ensure the goals are aligned and are of appropriate challenge. In juxtaposition, organizations that have managers set goals for their direct report need to ensure the goals are relevant, achievable, with agency to impact the outcome.
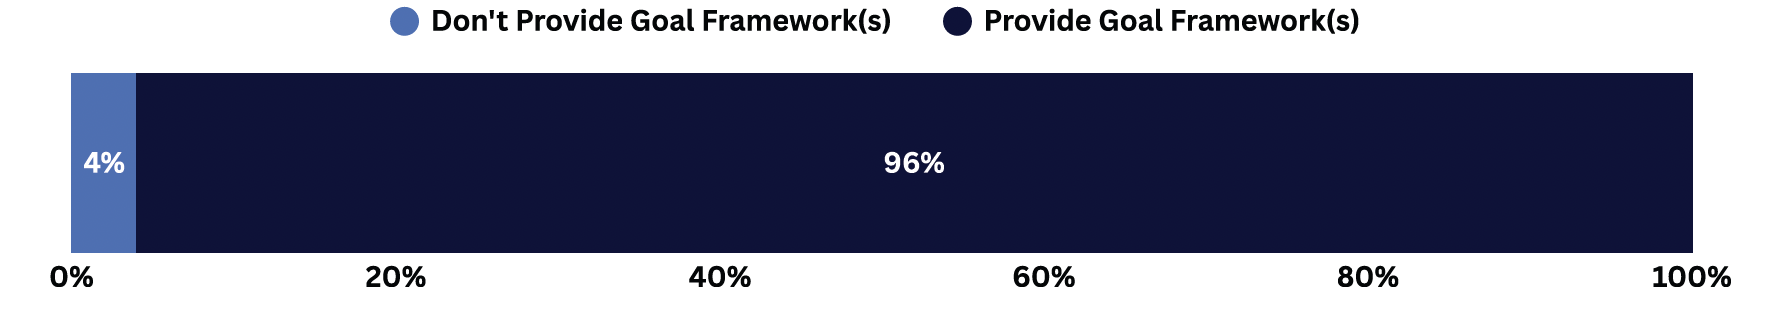
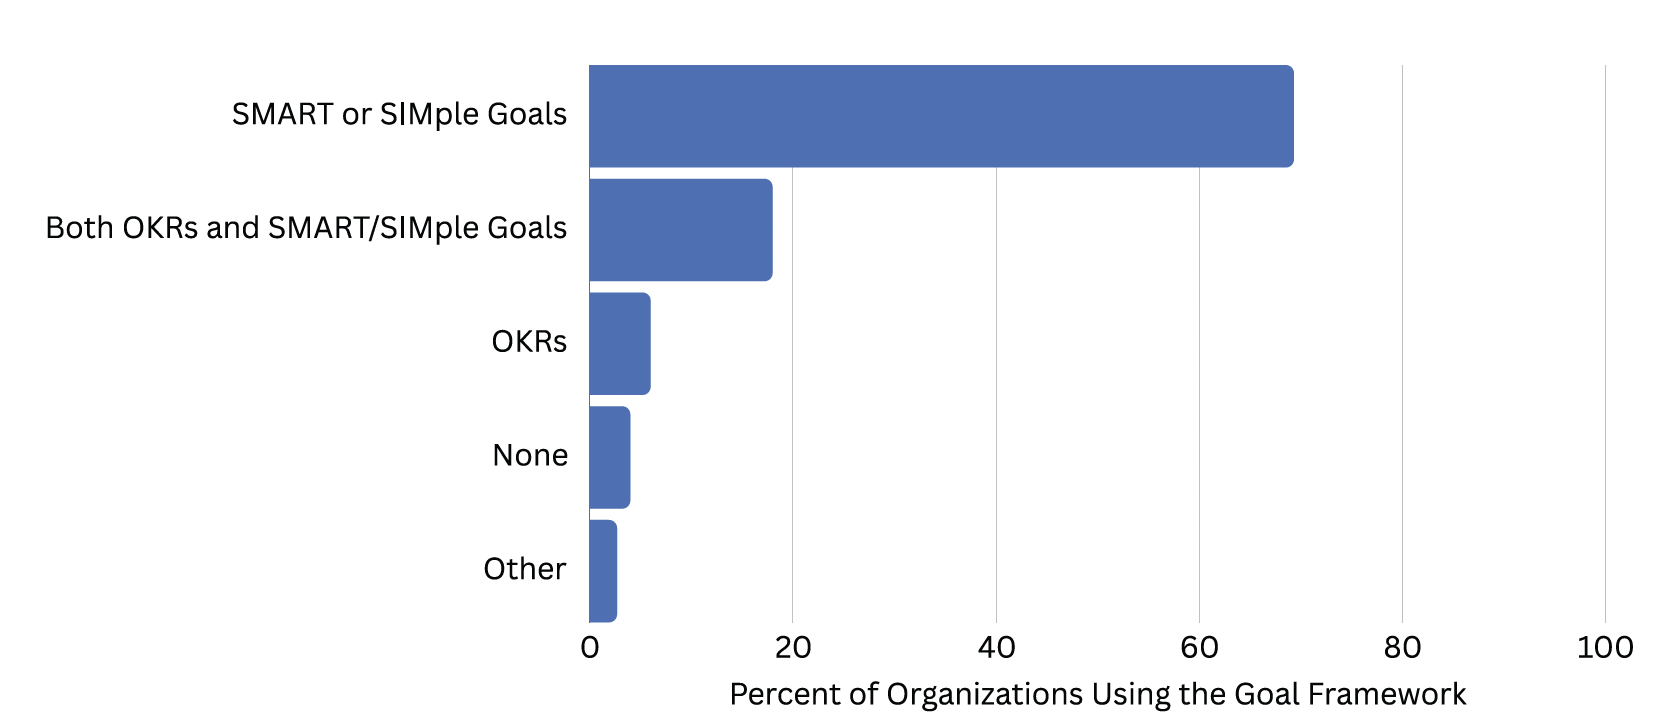
Nearly all organizations (96%) provide employees with one or more goal frameworks to guide goal setting. Organizations offer a single goal framework most commonly, with SMART and SIMple goals dominating organizational preferences (69.3%).
Additional patterns include:
- 6% of organizations exclusively use OKRs
- 18% of organizations recommend employees to use multiple goal frameworks (e.g., SMART goals and OKRs)
Similar to who sets the goal, there is no material difference in perceived Performance Management process effectiveness or participant capability based on the goal framework. However, recommending multiple goal frameworks does erode perceived effectiveness and participant capability. This makes logical sense, as multiple goal frameworks create the need to build capability for each framework introduced and could yield process complexities without benefit.
Key Takeaways:
- The specific goal framework used appears less important, with SMART goals/SIMple goals most frequently used.
- Recommending multiple goal frameworks is associated with worse perceived outcomes.
- Organizations are likely best served by selecting a single, credible goal framework and reinforcing consistent execution.
The Number of Goals and Timeline of Goal Setting Exceed Guidance
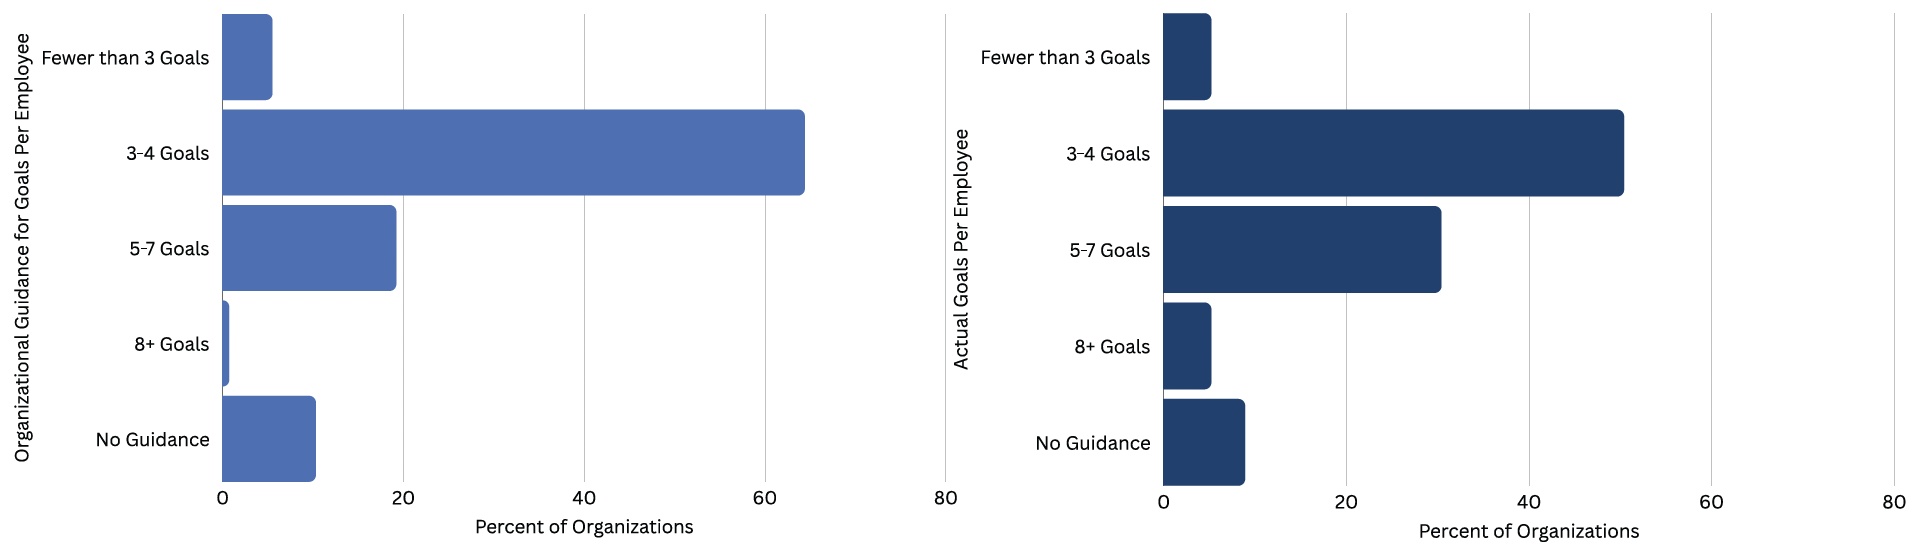
Organizations typically guide the setting of 3-4 goals per employee (64.4%) with the second most common goal number being 5-7 goals (19.2%). However, actual practice often exceeds this guidance:
- 50.4% of organizations report an average of 3-4 goals per employee
- 30.4% report an average of 5-7 goals per employee
- 5.2% report an average of 8 or more goals per employee
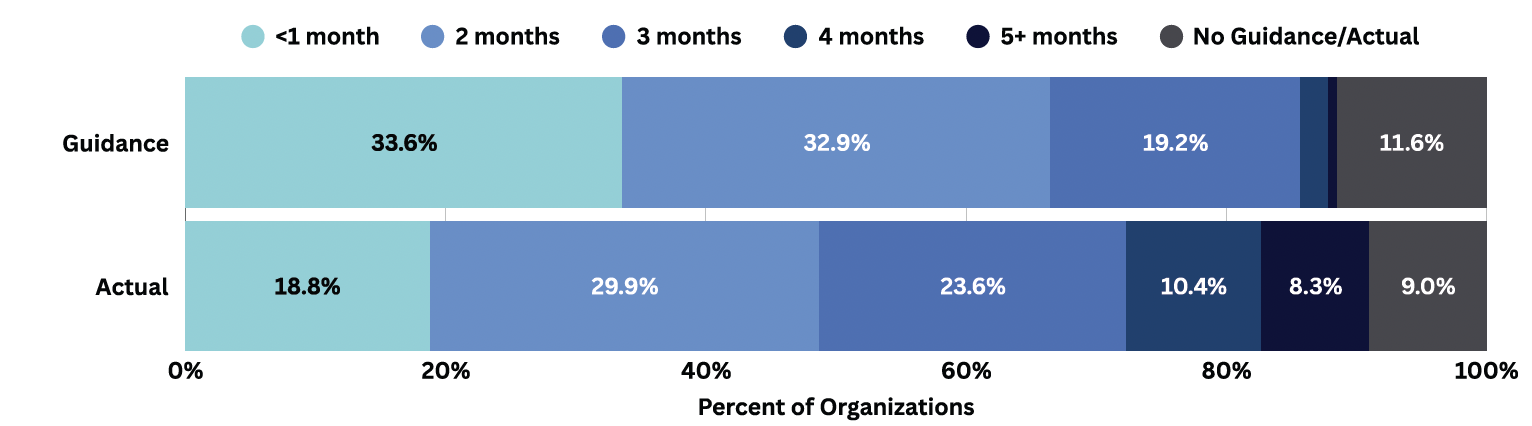
Similarly, the timeline of the goal setting process varies widely across organizations with actual timelines frequently exceeding organizational guidance.
- 33.6% of organizations target completing goal setting within one month of launch
- 32.9% target completion within two months of launch
In practice, many organizations take three months or longer to finalize goals:
- 23.6% take three months
- 10.4% take four months
- 8.3% take five months or longer
Perceived Performance Management effectiveness and participant capability are maximized when goal setting is completed within a 2-3 month window. Shorter timelines may feel rushed for large, complex organizations (particularly those using a goal cascade), while timelines extending beyond three months dilute clarity, urgency, and focus.
Key Takeaways:
- Individuals generally exceed guidance in the number of goals set and the time it takes to set goals.
- Three to four goals per employee is preferred, with many organizations exceeding this goal count on average.
- A two- or three-month goal setting process window appears optimal for most organizations: rushing the process sacrifices effectiveness while extending the process too long erodes effectiveness.
Goal Setting Technology Is Widely Adopted With Goal Weighting Widely Rejected
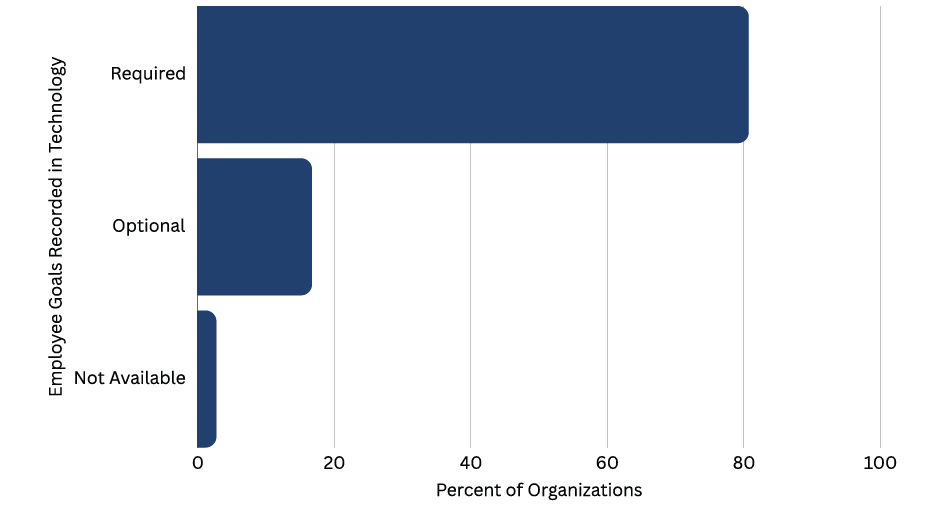
Goal setting technology has reached widespread adoption and utilization. Most organizations (80.7%) require employee goals to be documented within a technology platform. An additional 16.7% provide technology but do not require employees to document their goals in the technology. Only 2.7% of organizations lack technological support for goal setting.
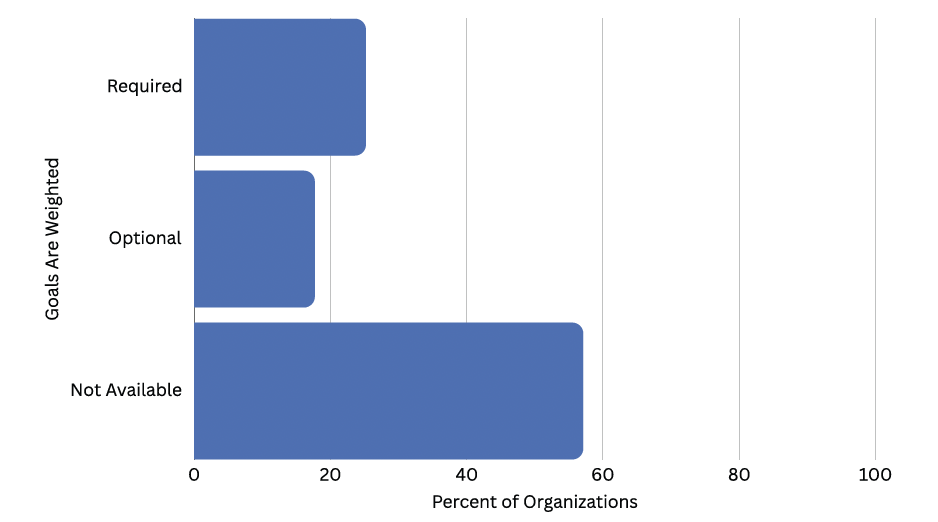
Despite widespread adoption of technology in goal setting, the use of goal weighting functionality – the assigning of relative importance or weight to each goal totaling 100% – remains limited. Only one in four organizations (25.2%) require goal weighting as part of the goal setting process. An additional 17.7% of organizations allow goal weighting on an optional basis, while the majority (57.1%) do not allow for goal weighting at all.
Notably, there are no material differences in perceived Performance Management process effectiveness or participant capability between organizations that use goal weighting (optionally or required) and those that do not. This suggests that the additional time and effort required to apply goal weighting might not reliably generate a measurable return on investment.
Key Takeaways:
- Technology-supported goal setting has reached widespread adoption.
- Goal weighting is not widely adopted and is not associated with stronger perceived outcomes, raising questions about its return on effort.
- Organizations should be cautious about adding process complexity, such as goal weighting, absent evidence that it improves performance.
Feedback Conversations Are Encouraged – Execution Falls Short
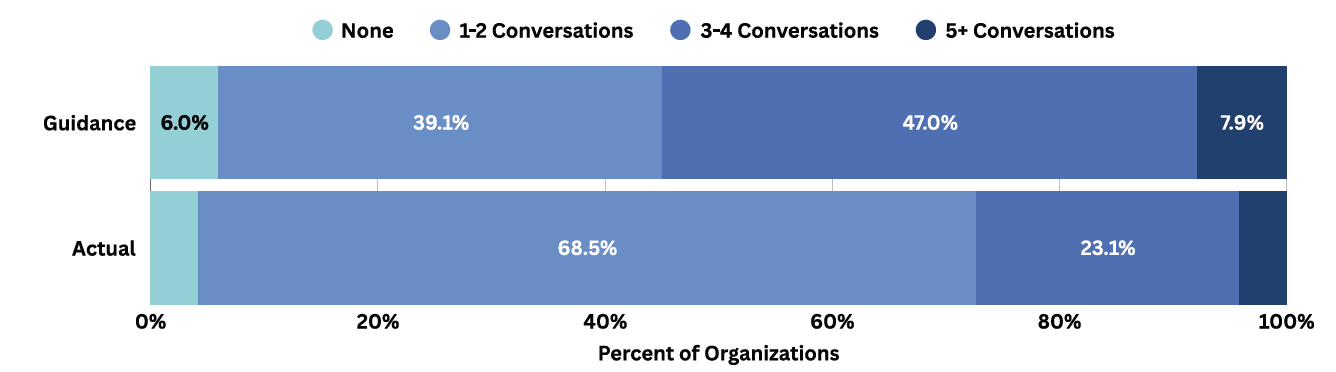
Most organizations encourage formal feedback conversations throughout the Performance Management cycle. Nearly half (47%) encourage three to four formal feedback conversations per Performance Management cycle, while an additional 39.1% encourage one to two. Only a small minority (7.9%) encourage more than four formal feedback conversations per year.
In practice, formal feedback conversations occur less frequently than organizational guidance:
- 68.5% report the typical employee has just one to two formal feedback conversations per performance cycle
- 23.1% report three to four conversations per cycle
- 4.2% report greater than four conversations per cycle
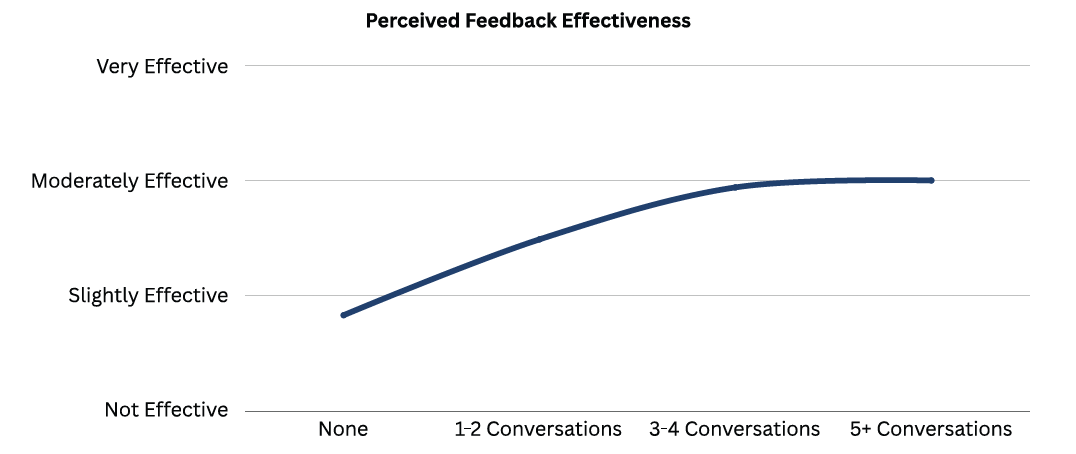
Processes that provide no guidance or measurement on feedback frequency are perceived as the least effective. More frequent feedback is correlated to more effective outcomes as the feedback conversation allows for the adjustment and/or reinforcement of expectations and the redirection and reinforcement of actions/ behaviors to enhance performance going forward. While perceived effectiveness continues to improve with more frequent conversations, gains appear to taper beyond four formal conversations per cycle, suggesting diminishing returns rather than unlimited upside.
Key Takeaways:
- Execution matters more than guidance – actual feedback frequency diverges from organizational guidance.
- Not measuring or providing guidance on feedback frequency is associated with the lowest perceived effectiveness.
- More frequent feedback conversations are generally better where three to four formal feedback conversations per Performance Management cycle appears to be the practical sweet spot.
Feedback Documentation Is Rarely Required and Downward Feedback Dominates
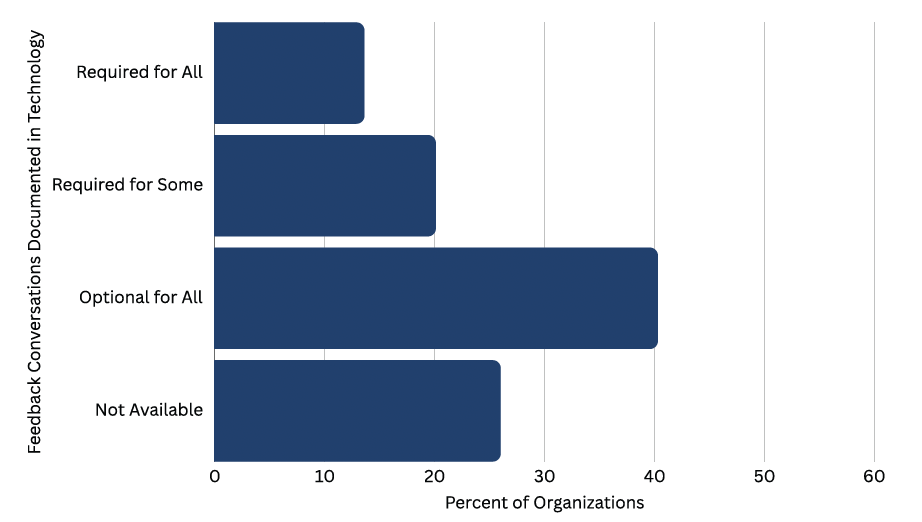
Despite encouraging formal feedback conversations, most organizations do not require those conversations to be documented in technology. Two-thirds (66.2%) don’t provide or optionally encourage documentation of feedback discussions. One in five organizations (20.1%) require documentation for some feedback conversations, while only 13.6% require documentation for all formal feedback conversations.
Organizations that require feedback documentation report higher perceived Performance Management effectiveness and participant capability. Compared to organizations that do not allow documentation, organizations requiring documentation for all feedback conversations reported 16% higher perceived effectiveness and 17% higher perceived participant capability. These findings do not suggest that the documentation of feedback itself causes increased effectiveness or capability – only that organizations disciplined to document feedback also report stronger outcomes.
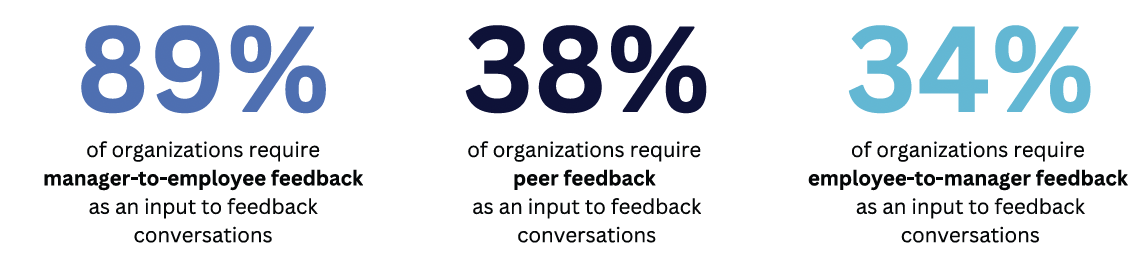
Downward feedback remains the dominant model of feedback direction. Nearly nine out of ten organizations (89%) require feedback conversations to include manager-to-employee feedback. In contrast, peer and upward (employee-to-manager) feedback is less common, with approximately one in three organizations incorporating these elements. While downward feedback is strongly associated with higher perceived effectiveness, peer and upward feedback show only marginal increases in perceived effectiveness despite their increased complexity to execute.
Key Takeaways:
- Most organizations encourage feedback conversations but do not require the conversation be documented in technology.
- Manager-to-employee (downward) feedback is the dominant and most impactful feedback mechanism.
- Peer and employee-to-manager (upward) feedback are less common and report only incremental effectiveness gains, suggesting higher execution complexity for less return.
Performance Reviewing Is Nearly Universal, Annual, and Rating-Based
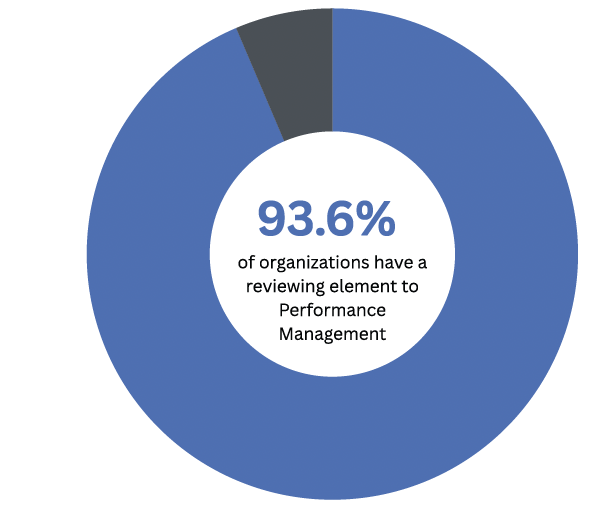
Nearly all organizations (93.6%) include a formal reviewing component within their Performance Management process. Organizations with a reviewing component perceive their Performance Management process to be meaningfully more effective – reporting 16% higher effectiveness in accurately assessing performance and 41% higher effectiveness in distributing compensation based on performance.
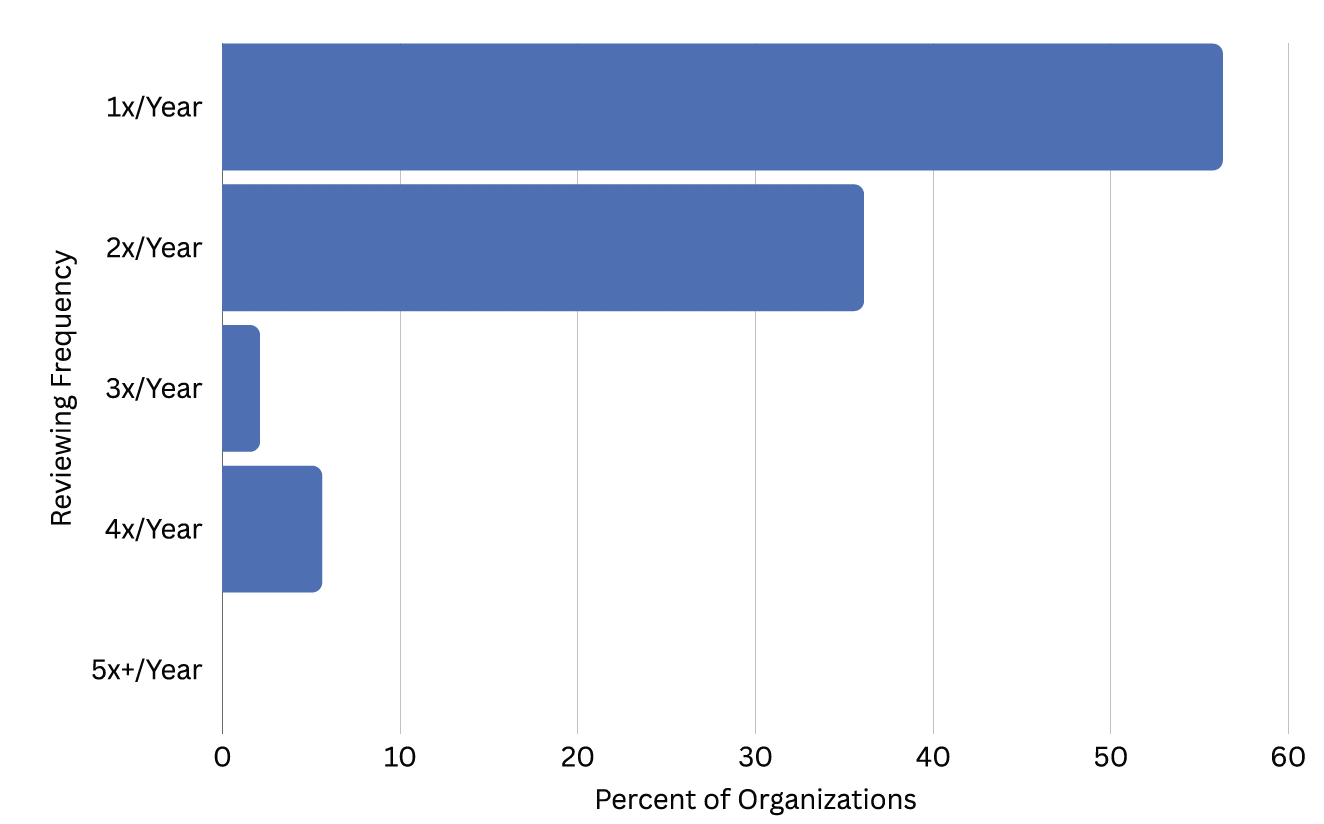
The majority of organizations (56.3%) review performance once per year, while an additional 36.1% review performance twice annually. Only 7.6% of organizations review performance more than twice per year.
Over the past decade, significant debate has surrounded rating-based versus ratingless Performance Management approaches. However, this debate appears largely resolved in practice. Nearly all (92.4%) organizations that review performance use ratings, while just 7.6% have a ratingless process. Notably, half of ratingless organizations are smaller as measured by employee count (<2,500 employees) and annual revenue (<$3 billion), suggesting that large and complex organizations overwhelmingly use ratings, while ratingless approaches are more common – but still a substantive minority – among smaller organizations.
Key Takeaways:
- Performance reviewing is nearly universal and is associated with more accurate performance assessment and more effective pay-for-performance decisions.
- Annual performance reviews are the dominant reviewing cadence.
- Rating-based systems dominate, particularly among large and complex organizations.
Results Lead Performance Assessment, With Single 5-point Ratings Most Common
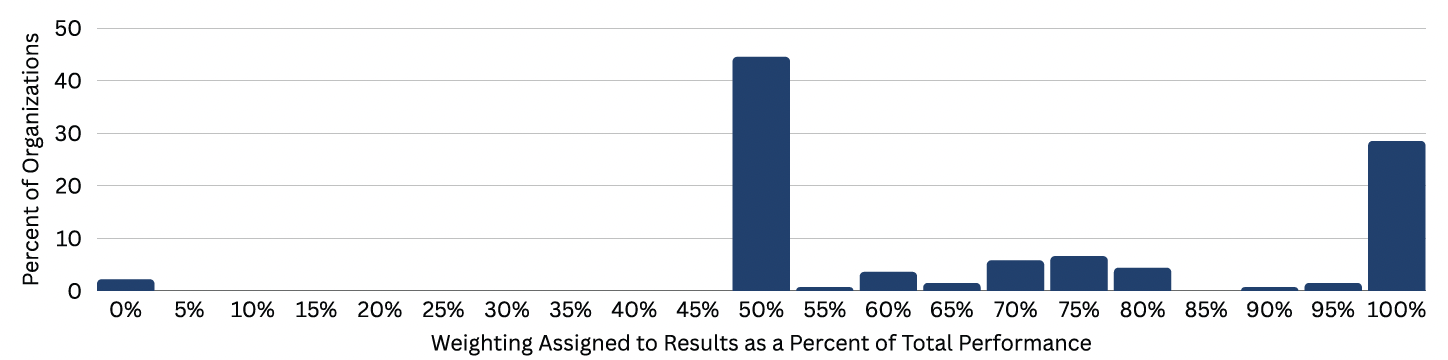
When reviewing performance, nearly half of organizations (44.5%) assess results and behaviors as equally important, assigning each a 50% weighting. An additional 28.5% of organizations do not explicitly review behaviors, placing 100% of the performance review emphasis on results. Only 2.2% of organizations weight behaviors more heavily than results when reviewing performance.
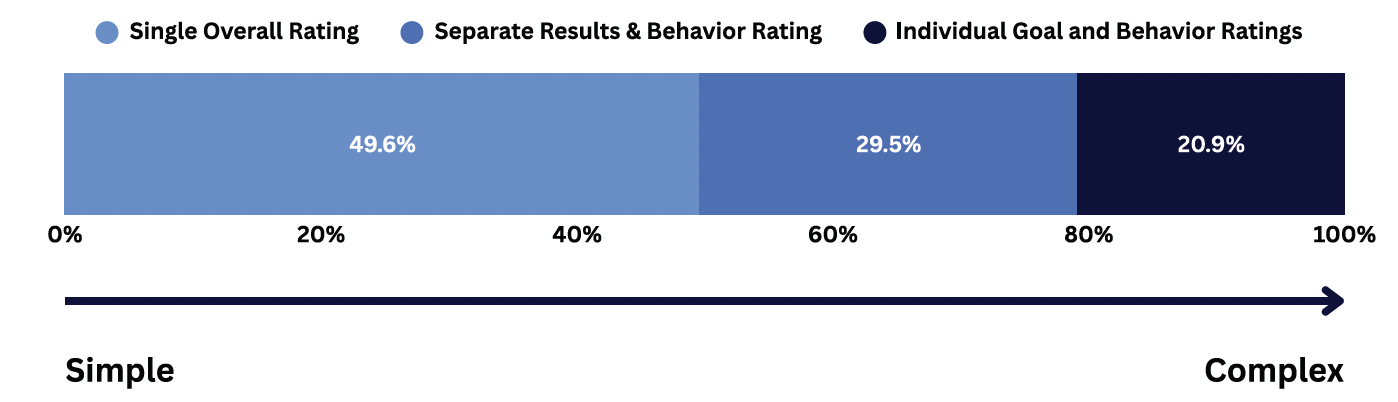
Among organizations that rate performance, simplicity in the rating architecture is preferred. Nearly half (49.6%) use a single overall performance rating. An additional 29.5% rate overall results and behaviors separately, with an overall performance rating assigned or calculated. Just 20.9% employ more granular approaches that rate individual goals and individual behaviors.
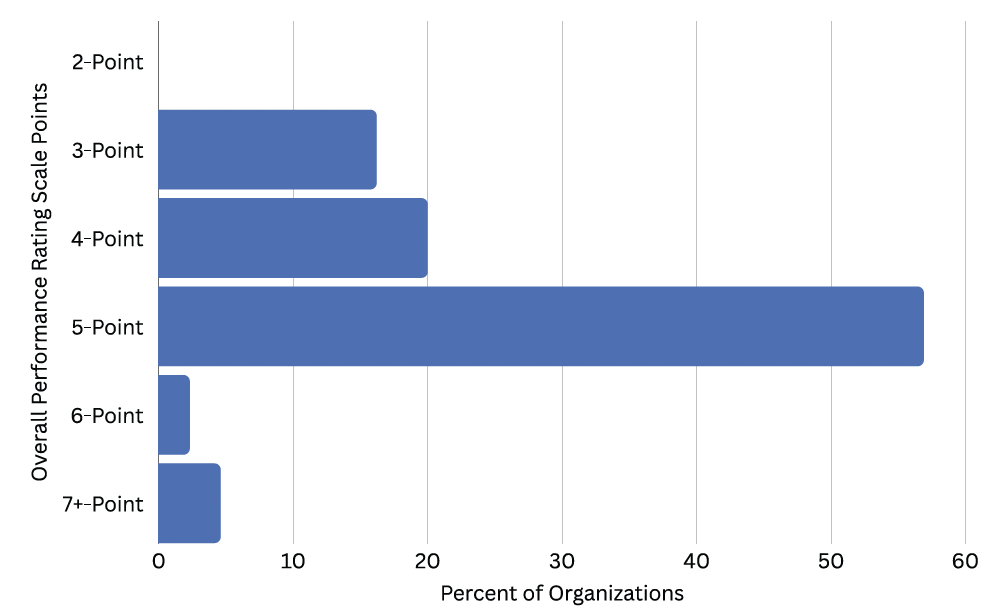
When an overall performance rating is used, the 5-point scale dominates. Nearly three in five organizations (56.9%) rely on a 5-point rating scale, followed by a 4-point scale (20%). A three-point scale (16.2%) and scales with six or more points (6.9%) are used far less frequently.
Taken together, these findings suggest that while organizations acknowledge the importance of behaviors, results remain the primary driver of performance assessment. Further, simple rating scales are favored over more complex rating designs.
Key Takeaways:
- Results are weighted more heavily than behaviors in most performance reviews.
- A single overall performance rating is the most prevalent rating architecture.
- The 5-point rating scale is the dominant rating scale across organizations.
Performance Distributions and Calibrations Are Widely Used
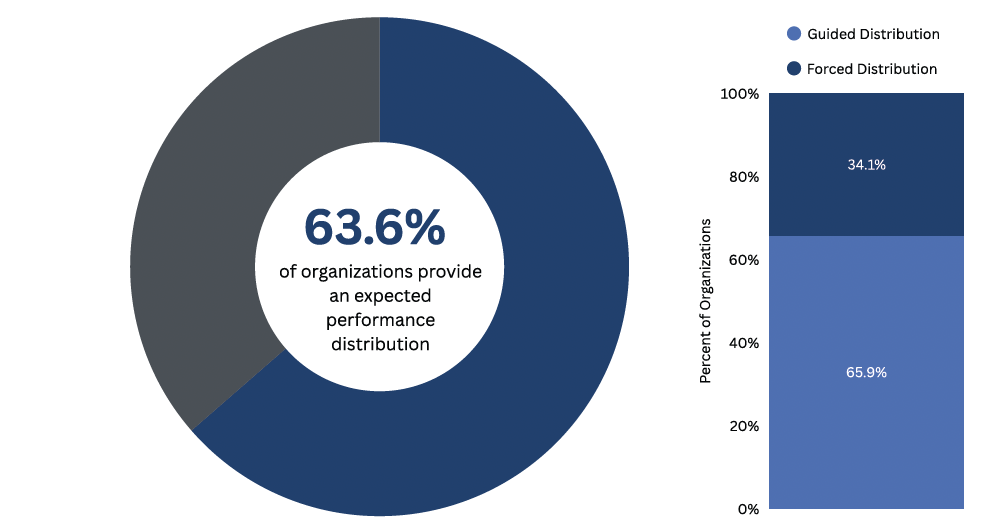
Most organizations (63.6%) provide assessors with an expected performance distribution. Among these organizations, 34.1% use a forced distribution – requiring adherence to a fixed percentage allocation of performance ratings – while 65.9% use a guided distribution, in which assessors are given an expected distribution but retain discretion to deviate from the guidance.
Despite the negative associations many HR and business leaders hold with performance distributions – particularly forced distributions – perceived effectiveness in accurately assessing performance and distributing compensation based on performance increases as distributions become more defined and forced. This suggests that clearer expectations around performance differentiation may enhance assessment accuracy, improve consistency, and support compensation decision making.
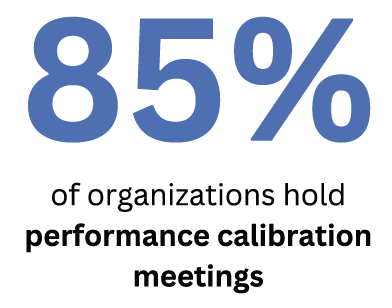
Performance calibration is also widespread. More than four out of five organizations (84.7%) hold performance calibration meetings, most commonly at the business unit or functional level. Less commonly, calibration meetings also occur by level and/or geography. Calibration often serves as the mechanism through which performance distributions are reviewed, debated, and ultimately aligned across assessors.
Key Takeaways:
- Performance distributions – both guided and forced – are commonly used to shape performance assessment and compensation outcomes.
- More defined and forced distributions are associated with higher perceived effectiveness in assessment and pay differentiation.
- Performance calibration is a near-universal practice and is most often conducted at the business unit or functional level.
Performance Is Commonly Linked to Merit and Short-Term Incentives
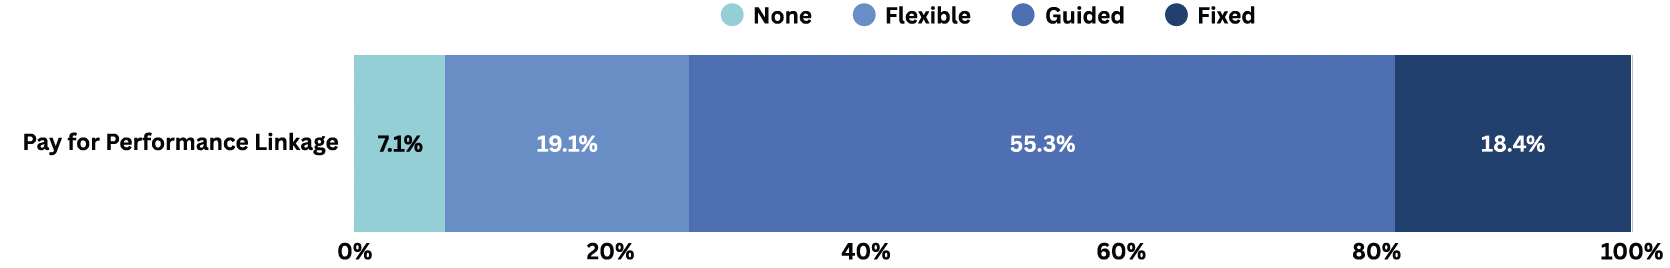
Most organizations explicitly link compensation outcomes to their Performance Management process, with just 7.1% of organizations reporting they do not connect performance assessment and rewards. The most common approach (55.3%) is a guided linkage, in which organizations define reward ranges by performance rating while allowing managers discretion within those ranges. An additional 18.4% of organizations use more direct linkages that tightly prescribe reward allocations by performance rating, while 19.1% allow managerial discretion with minimal guidance.
These patterns suggest organizations are seeking to balance consistency and fairness of rewards with manager discretion and judgment, rather than relying exclusively on rigid formulas or forced rewards allocations.
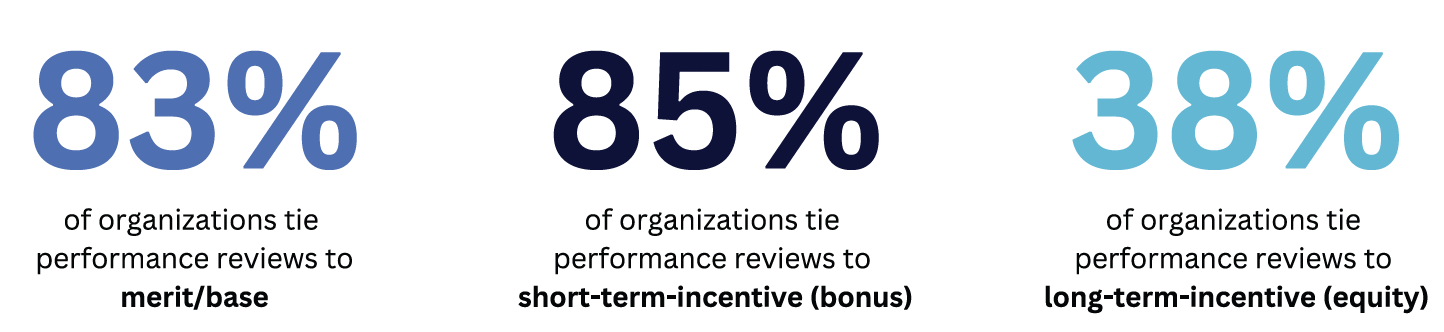
Pay for performance is most commonly tied to base salary increases (merit) and short-term incentives (bonus), with 82.5% and 84.9% of organizations, respectively, linking performance to these reward elements. Fewer organizations (38.1%) link performance assessment to long-term incentives such as equity.
Key Takeaways:
- Most organizations explicitly connect performance assessment to rewards, reinforcing a pay for performance orientation.
- Guided rewards approaches – balancing consistency with manager discretion – are most common.
- Merit increases and short-term incentives are the primary reward vehicles influenced by performance assessment.
Performance Management Training Is Underutilized While AI Adoption Is Nascent
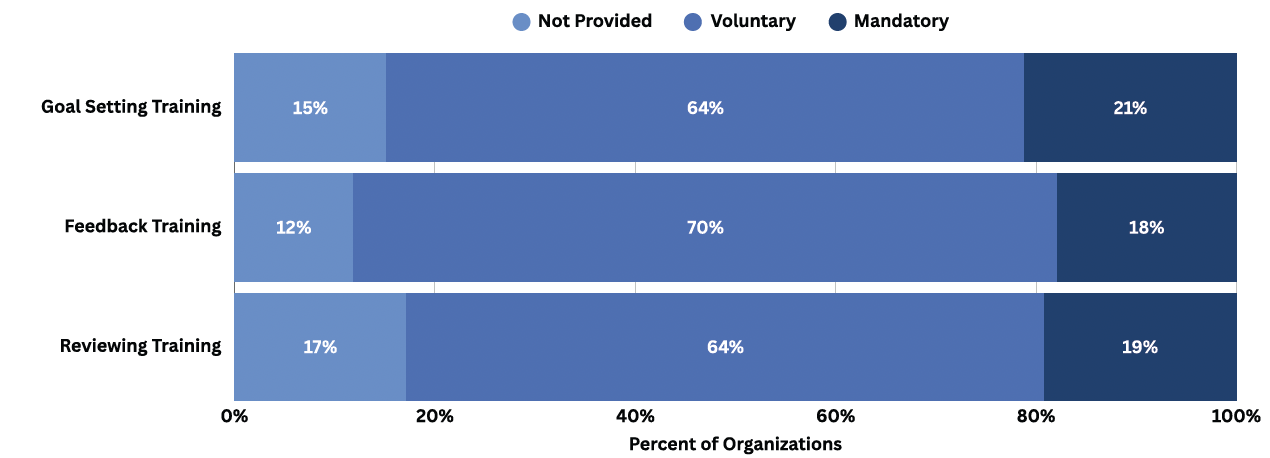
Training on core Performance Management activities – including goal setting, feedback, and reviewing – is associated with higher perceived process effectiveness and participant capability. Moreover, the strength of this relationship increases as training becomes more prescriptive, with mandatory training associated with the highest perceived outcomes. Despite this, mandatory training remains uncommon with only 21.2% of organizations mandating goal setting training, 17.9% mandating feedback training, and 19.2% mandating reviewing training.
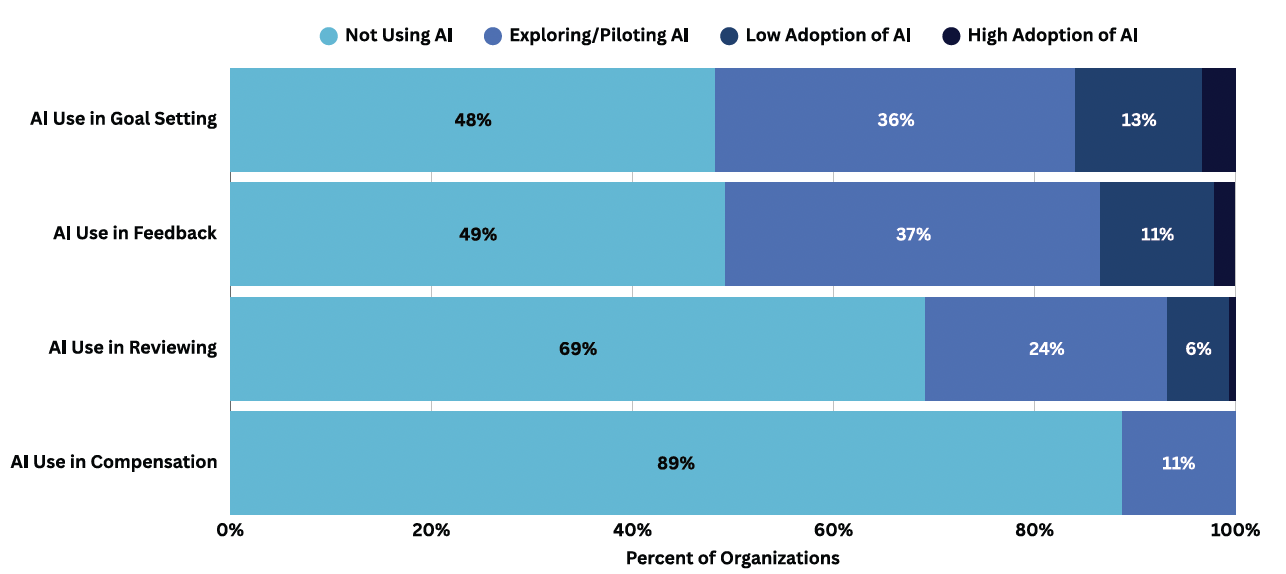
The use of Artificial Intelligence (AI) in Performance Management is emerging but is largely experimental. AI adoption is highest in goal setting and feedback and coaching, where organizations appear to be testing AI-supported tools rather than embedding AI at scale. Nearly half of organizations report no AI use in goal setting (48.3%) or feedback and coaching (49.3%). Among organizations using AI, the majority are piloting or experimenting, with just 3.3% reporting AI as nearly fully embedded in goal setting and 2% in feedback and coaching.
AI adoption is even less prevalent in reviewing and compensation decisions. More than two-thirds of organizations (69.2%) do not use AI in reviewing, and nearly nine out of ten (88.7%) do not use AI to assist
with distributing compensation. Despite limited adoption, organizations experimenting with AI report higher perceived process effectiveness than organizations not using AI. However, as has been referenced throughout, these findings reflect correlation rather than causation and may reflect broader differences in Performance Management maturity or investment. As adoption increases, organizations will need to distinguish between AI that augments human judgment and AI that attempts to replace it.
Key Takeaways:
- Training in core Performance Management activities is associated with stronger perceived outcomes, yet mandatory training remains uncommon.
- AI adoption in Performance Management is early-stage and experimental across all process areas.
- Organizations experimenting with AI report higher perceived process effectiveness, though these findings reflect early adoption and correlation, not causal impact.
CONCLUSION
Performance Management has reached near full adoption as a management process, but not necessarily effectiveness as a management practice. Most organizations have the core Performance Management components in place, including goal setting, feedback conversations, reviewing, calibration, and pay-for-performance linkages. What differentiates strong outcomes is not necessarily innovative process design, but disciplined execution.
Across the data, a clear pattern emerges. Simplicity outperforms complexity. Structure and clarity outperform ambiguity. Execution matters more than intent. Organizations with structured goal cascades, formal feedback conversations, defined performance distributions, and explicit compensation linkages – while sometimes unpopular – report stronger outcomes than those relying on looser or more discretionary approaches.
Despite this, many organizations continue to treat Performance Management redesign as the primary lever for improvement. The findings challenge that assumption. Recent process redesign shows no meaningful relationship with higher perceived effectiveness. Redesign also carries real costs – change fatigue, capability resets, and erosion of process credibility. To be clear, redesign can be very valuable, but without a precise articulation of which outcomes a redesign is meant to improve, organizations risk mistaking change for progress.
The data also point to a material underinvestment in capability building. Mandatory Performance Management training is strongly associated with better outcomes, yet remains uncommon. Technology and AI may offer future leverage, but adoption is still nascent and cannot substitute for a clear process, managerial skill, or accountability.
Improving Performance Management, therefore, is about committing to a foundationally strong Performance Management process, executing it consistently, and building the capability and accountability to sustain it. An opportunity for most organizations lies in tightening execution, reinforcing accountability, and leveraging Performance Management not as a compliance requirement, but as a core mechanism for value creation.
ABOUT
The Data
This report was produced by reviewing data from over 250 organizations that completed a benchmarking survey. These 250 organizations include strong representation for small, medium, and large sizes (as measured by employee headcount and annual revenues) and a mix of public and privately held organizations. All data were gathered in November and December 2025.
As with any data gathering effort, this survey could be subject to biases including selection bias, response bias, and sampling bias. We are confident that the data reflect a representative sample of organizations, but you should apply your own skeptical lens when analyzing the results. Further, perceived effectiveness and participant capability reflect respondents’ subjective assessment of their organization’s Performance Management process outcomes. While perception is important, perception differences may reflect broader organizational maturity differences rather than causal links.
The Author
Zac Upchurch leads the Talent Strategy Group, an HR and Talent Management consulting firm. He frequently consults with the Boards and Executive Teams of the world’s most advanced organizations on Human Resources and Talent Management with a focus on the intersection of people and organizations and maximizing the full value of both. Zac graduated Summa Cum Laude from Arizona State University with a Bachelor of Science in Economics.
He can be reached at zac@talentstrategygroup.com.
The Talent Strategy Group
The Talent Strategy Group helps the world’s premier companies, governments, foundations and non-governmental agencies transform human resources and their ability to grow talent. Our advisory services include HR strategy, organization design, HR leader assessment and HR process design, among others. Our education and development services are based at our Talent Management Institute, which is the world’s most popular executive education program on talent. We teach executives and HR leaders how to build better talent faster through our public and private programs.
We advise across sectors and geographies. We have deep consulting experience in consumer products, big food, technology, pharmaceutical and bio-pharmaceutical companies, medical devices, financial services and health care. We partner with private equity firms to assess and develop talent for C-suite roles.