HR Operating Model Report 2023
Post content
About This Report
The 2023 HR Operating Model Report provides specific insights as to how companies are structuring and operationalizing HR. More than 200 companies worldwide participated with strong representation across small, medium and large organizations. All data was gathered in early and mid-2023.
This report provides you with insights on the structure of COEs and their reporting relationships, HRBPs and their relationships with COEs, facts about shared services organizations, and more.
We consider this data to be insights but not benchmark information. We strongly caution our readers from drawing conclusions about what is correct or incorrect based solely on these findings.
As with any data gathering effort this survey could be subject to biases including selection bias, response bias and sampling bias. We are confident we have a representative sample of companies around the globe, but you should apply your own skeptical lens when you analyze the results.
We hope you find the results valuable, and we would be happy to support your company to assess and enhance the effectiveness of your HR operating model.
Best regards,
Marc Effron, President, Talent Strategy Group
Executive Summary
We find strong global interest from companies about how to optimize their HR operating model. Some are frustrated that their HR restructuring didn’t deliver a better operating process. Some assumed that their HR organization was operating effectively only to have conflicts and questions undercut their ability to deliver. Some were searching for the ever elusive “new” operating model that would magically deliver better results.
HR Structure: We described in our article “It’s the Mortar, Not the Bricks” that the debate about the Ulrich model was over and that Dave Ulrich won. The traditional thee-pillar system dominates what companies use, so we didn’t survey companies about their current structural choice.
The responses to our questions about COEs, HRBPs and Shared Services confirmed the dominance of this structure.
Confirmed, at the table: 86% of CHROs report directly to the CEO, so the “at the table” question is settled. The open question is are they making good use of that seat.
More HR, everywhere: The number of HR team members expanded across every part of HR, led by Talent Acquisition and DE&I. The support ratio for HRBPs to employees has decreased.
Getting along better, but room to grow: The classic HRBP vs. COE conflict level seems to have moderated, with 56% responding that these groups largely or often worked well together.
A few COEs dominate: A clear hierarchy exists within the COE world with Total Rewards and Talent Management reporting directly to the CHRO 80%+ of the time. Talent Management is the COE with the most other COEs reporting into it. If not reporting to the CHRO, more than 50% of Learning and Development, Assessment and Talent Acquisition groups report into Talent Management.
Service centers: A majority of companies (68%) have a formal service center and they’re typically centralized rather than regionalized.
No help in making the model work: 6 in 10 companies that changed their operating model provided no training to help leaders succeed in the new model.
We hope you find value in our report. We appreciate the opportunity to keep you informed with unbiased research presented in an easily digestible format.
Overall
1. CHRO REPORTING
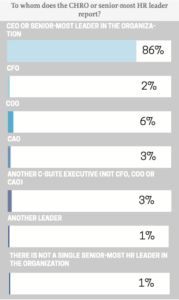
Finding: HR leaders are definitely “at the table” in nearly every company with 86% reporting directly to the CEO. Within the remaining 14%, many reported to the COO with the others spread across other C-suite officers. The 14% of non-CEO direct reports was spread relatively evenly across larger and smaller companies.
Observation: This finding suggests that CHROs are strongly positioned for influence and that HR has achieved the structural success it has long sought. Structure doesn’t equal impact however, so we consider this finding to place HR “in the race” but it offers no insights to how we’re completing.
COEs
2. COE REPORTING
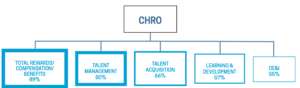
Finding: Total rewards/compensation and Talent Management emerge as the clear winners in the competition to always report to the CHRO at 89% and 80% of the time. Below those two COEs, relatively similar percentages of Talent Acquisition, Learning and Development and DE&I report to the CHRO a majority of the time.
Observation: A clear hierarchy of COEs emerges from this question, with Total Rewards and Talent Management at the top and all other COEs meaningfully below that. Reinforcing that finding is that many of those functions report to Talent Management including L&D, Talent Acquisition, Assessment and, often, Engagement.
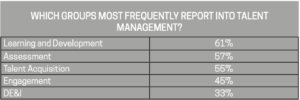
3. WHEN COEs DON’T REPORT TO CHRO, THEY REPORT TO:
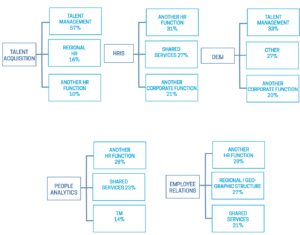
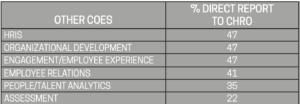
Finding: There is no consistent reporting pattern for COEs that don’t report to the CHRO. The Talent Management COE is the most common destination.
The fact that People Analytics reports more frequently to Shared Services and Other HR Functions than to the CHRO or Talent Management suggests a potential misunderstanding of the strategic role of the function. It may also, however, suggest that the COE is providing more reporting and less true analytics in many organizations.
Observation: The findings in #2 and #3 suggest that 4 – 5 COEs report to the CHRO which, in addition to a regional- or BU-based HRBP reporting relationship, should put the typical CHRO span of control in a range of 8 – 10.
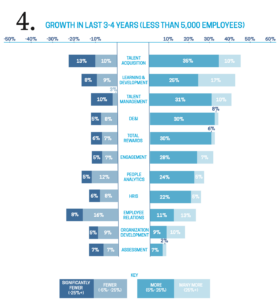
4. HOW HAS COE HEADCOUNT CHANGED?
Finding: Significant COE growth occurred across nearly every category of large and small companies with additions in Talent Acquisition, DE&I and People Analytics in more than 40% of companies. The greatest net growth (companies hiring minus companies reducing) took place in People Analytics (net +52%) and DE&I (net +43%). Small companies were more balanced with the greatest gains occurring in Talent Management (net +28%), Learning and Development (net +25%) and Talent Acquisition (net +22%).
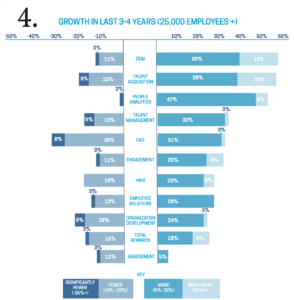
Larger companies (25K+ employees) went on a hiring spree over the past few years with positive growth in every COE category but Assessment. DE&I led that spree with 58% of companies adding more employees and 18% of those companies adding 25% or more employees in that space.
Talent Acquisition is a close second with 56% of large companies adding staff and People Analytics is not far behind with 55% of companies hiring. Talent Acquisition and DE&I were the only COEs where a double-digit percent of companies grew by those functions by more than 25%.
Within large companies, L&D and Assessment both showed small net reductions in staff.
Smaller companies (less than 5K employees) were slightly more conservative with 45% of companies adding Talent Acquisition team members, 42% adding Learning and Development and 41% adding Talent Management staff.
Smaller companies were net neutral in their Employee Relations hiring and net negative in Assessment hiring.
This data was gathered during the 2023 staff reductions in the tech and select other sectors.
Observation: The strong, across the board growth in COE hiring should be a positive indicator for the function. However, the level of growth in some COEs is so far above the growth in the broader business environment to suggest over hiring that will lead to layoffs. That reality is already being seen in Talent Acquisition and DE&I layoffs in mid-2023.
Significant differences between large and smaller company hiring is most obvious in People Analytics (55% in large companies vs. 29% in smaller ones) and DE&I (57% in large companies vs. 38% in smaller ones). Both are relatively newer COEs so it’s possible that all companies are building those groups and larger companies have more budget to allocate to growing them.
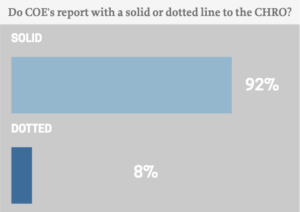
5. DO COE’s REPORT WITH A SOLID OR DOTTED LINE TO THE CHRO?
Finding: The overwhelming majority of companies have COEs report to their CHRO. Of the 8% of companies that do not, only 1% are large companies.
Observation: File this in the “no surprises” category with companies showing a very logical approach to COE reporting relationships. This direct line relationship ensures consistent design and execution of the core COE processes like performance management, bonus design, talent reviews, branding, engagement surveys, etc.
There is less consistency to the reporting relationship shown in Questions 6 concerning regional and business unit HRBP reporting. 24% – 30% of those groups have a dotted line reporting relationship to the CHRO.
HRBPs
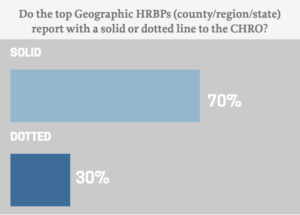
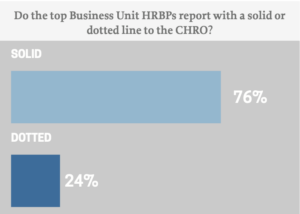
6. DO HRBPS (IN B.U.’S OR GEOGRAPHIES) REPORT WITH A SOLID OR DOTTED LINE?
Finding: While nearly all COEs report directly to the CHRO (or up through another COE), 30% of geographic HRBP groups report in a dotted line to the CHRO. Business unit HRBPs have a dotted line relationship to the CHRO 24% of the time
Observation: Our experience is that direct line reporting helps to drive a consistent HR agenda. The risk of dotted line reporting is that the HR leader might align more to the priorities of the geographic or business unit leader. This can be largely avoided by having a people agenda that’s supported at the executive team level, the CHRO having strong influencing skills and the geographic or business unit HR leader understanding the long-term consequences of not aligning to corporate HR’s strategy.
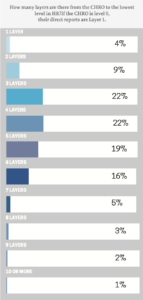
7. LAYERS ARE REASONABLE; MINOR VARIATION BY COMPANY SIZE
Finding: Companies feature three to six layers between the CHRO and the lowest level of HR. That number changes slightly with size. Companies with fewer than 25,000 employees have 4.5 layers on average and companies with more than 25,000 employees have 5.6 layers on average.
Observations: These numbers suggest that there’s reasonable depth in most HR organizations. Our guidance to clients in this area is that there is no correct number of layers but that all layers should be purposeful in their design. As a rule of thumb, we believe that five layers is an appropriate target to ensure fast information flow and still allow for large promotional steps.
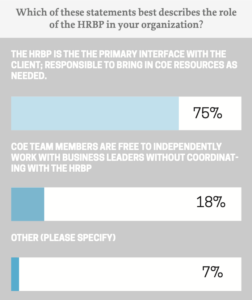
8. WHICH OF THESE STATEMENTS BEST DESCRIBES THE ROLE OF THE HRBP IN YOUR ORGANIZATION?
Finding: It’s rare for COEs to have direct (not brokered) access to business leaders, with only 18% able to operate that way.
Observation: This finding strongly reinforces the separation of powers between COEs, HRBPs and Shared Services. In 75% companies the HRBP “owns” the relationship with the business leader. It also highlights the cause of a persistent tension between COEs and HRBPs (shown in Finding 9 below) about how they work effectively together.
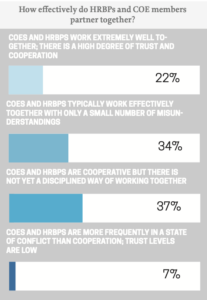
9. HOW EFFECTIVELY DO HRBPs AND COE MEMBERS PARTNER TOGETHER?
Finding: There’s progress but room to grow in the partnership between COEs and HRBPs. It’s great that in 1 in 5 companies these groups partner well. And, the fact that another 34% partner pretty well isn’t bad either. That still leaves 44% of companies where the operating model and process isn’t working at an acceptable level.
Observation: This conflict is historical (we’ve heard about it for 30 years), human (there’s a natural fight for power, turf and control in organizations) and solvable if HR groups come together for an operating model planning event.In the meantime, line managers in 44% of companies are confused about who does what in HR and wishes that the function would figure it out.
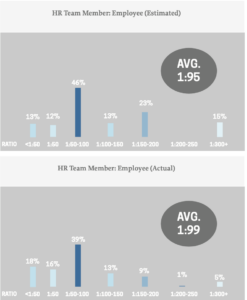
10. HR RATIO REMAINS AT HISTORICAL AVERAGE
Finding: The ratio of HR employees and HRBPs to overall employees are two of the most telling metrics for the overall leanness of an HR organization. We present both ratios and show findings from asking the question in two ways.
We know that survey respondents often estimate their data when answering questions like these, so we provided a choice to answer with actual data or estimated data. The average ratios between the estimated and actual data were amazingly similar.
Observation: Both the actual and estimated HR:total employee ratio were quite close to the classic ratio of 1:100 HR employees, with 1:99 and 1:95 respectively. The fact that this HR rule-of-thumb still holds true 30 – 40 years after its creation my indicate either that:
1. There’s significantly more value adding parts of HR today including talent management, DE&I, people analytics, etc. yet the total ratio hasn’t shrunk. That suggests the function has effectively swapped lower value work for higher value work.
2. We’ve not found true efficiencies that allow us to lower this ratio, either through a failure to empower managers, use technology effectively or to design simpler solutions to HR challenges.
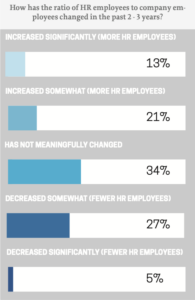
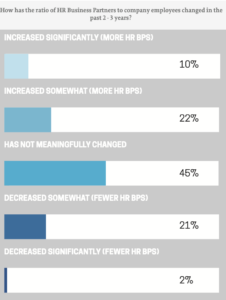
11. HOW HAS THE RATIO OF HR EMPLOYEES TO COMPANY EMPLOYEES CHANGED IN THE 2 – 3 YEARS?
Finding: A roughly similar number of companies have increased versus decreased the ratio of HR employees to total company employees over the past few years. While 27% of companies somewhat reduced that ratio, 34% of companies either significantly increased or somewhat increased the ratio of HR employees to total employees.
Observations: Given the earlier findings on the strong increases in COE hiring, it suggests that in ⅔’rds of companies either HRBPs or service center employees were reduced to keep this ratio the same or to lower it. This raises the question about where the value of HR work lies – in the execution of specialized skills or at the interface with the business?
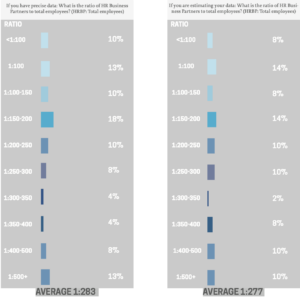
12. HRBP SUPPORT RATIOS VARIABLE
Finding: The HRBP support ratio was highly variable across the respondents with an average of 1:283 in the actual observations and 1:277 in the estimated observations.
Observations: We’re seeing a clear trend of more leanly staffed HRBPs and more work shifted to service delivery. Ratios of 1:500 and above are not uncommon as shown by 21% of responding companies being in that range.
We also find many organizations that are trying to make that shift but find HRBPs refusing to force transactional work to service centers. There is a natural reluctance of managers to give up their local HR support, but also HRBPs who enable that by providing personalized service when work should be done by a service center.
13. HBRP SUPPORT REMAINS CONSISTENT
Finding: Largely consistent with the findings on HR support ratios, the support ratio of HRBPs to company employees has remained largely the same with a net increase in 9% of companies.
Observations: While the numbers remain relatively similar, an open question is about the content of the HRBP role. Are these HR BPs still acting like generalists or have they truly elevated their HR game to be a strategic advisor in the eyes of their clients?
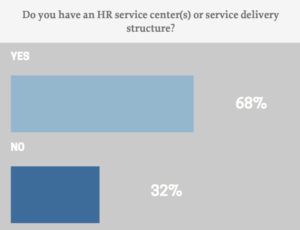
14. HR SERVICE CENTER(S) OR SERVICE DELIVERY STRUCTURE
Finding: About 2/3rds of responding companies had an HR Service Center or Service Delivery structure. There is a very clear trend by company size with 99% of companies having more than 25,000 employees having this structure and less than 50% of companies with 5,000 or fewer employees having a service delivery function.
Observation: This data reinforces the ubiquity of the classic Ulrich model with companies of size establishing a dedicated service center or service delivery structure to drive efficiency.
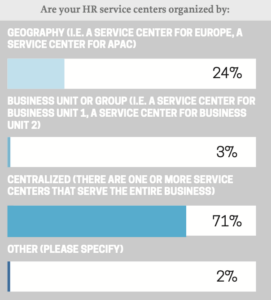
15. HOW ARE HR SERVICE CENTERS ORGANIZED
Finding: Centralized service centers dominate the structure choice with 71% of companies not dividing service centers by geography or line of business. But there is a strong size component to that choice, with 40% of companies having 25,000 or more employees using either a Geography-specific or Business unit-specific service delivery structure.
Observation: There appears to be a tipping point at about 25,000 employees where it makes economic sense to have service centers with regional specialization.
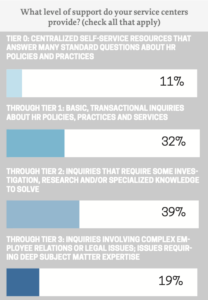
16. TIER 1 & TIER 2 SUPPORT DOMINATES
Finding: The majority of organizations with service centers provide support at least through Tier 2. Organizations with more than 25,000 employees are less likely to provide Tier 2 and 3 service, with only about 1/3rd providing support at that level.
Observation: With 43% of organizations providing only the most basic levels of support, there’s a significant opportunity for companies to routinize and standardize more sophisticated HR inquiries. The ability to serve Tier 2 inquiries is often a function of moving business unit or geographic HR generalists into a structured Tier 2 level managed by the service center. This choice also forces efficiency at the HRBP level since they no longer have large downline teams to answer semi standard inquiries or manage special projects.
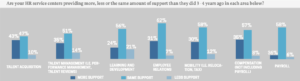
17. HOW MUCH SUPPORT ARE SERVICE CENTERS PROVIDING?
Finding: Nearly all service centers are providing a greater level of support in key functional areas than they were 3 to 4 years ago. The most significant increase in support is in Talent Acquisition (43%) and the smallest increase is in Learning and Development (23%). Learning and Development also showed the greatest decrease in support (21%) resulting in a very small net positive change in that area.
Observation: These meaningful increases in the volume of work at service centers as a positive sign for the efficiency goals of HR. To an earlier question, additional shifting of Tier 2 and Tier 3 inquiries to the service center should help to further support the emergence of “pure” HRBPs and COEs.
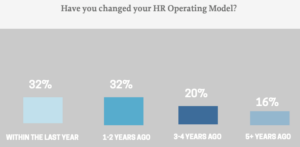
18. EVERYONE’S CHANGED THEIR MODEL!
Finding: Nearly 2/3rds of HR organizations made changes to their design or operating model within the past two years. This indicates a widespread dissatisfaction with the current functioning of HR operating models and a search for more effective solutions.
Observation: Our client experience suggests that it’s not new HR operating models that are needed but more clarity and discipline in operationalizing the current model. We typically find that the interactions between COEs, HRBPs and service centers have not been properly mapped out. This leads to battles over power, turf and control, which then undercut the ability of any HR operating model to be successful.
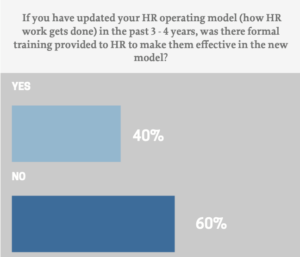
19. WAS THERE FORMAL TRAINING PROVIDED TO HR TO MAKE THEM EFFECTIVE IN THE NEW MODEL?
Finding: Not even a majority of companies trained their HR team members in how to be effective in their new operating model. This feels like an easy explanation for why many of these updated models operate at less-than-optimal effectiveness. Large companies were slightly better on this question with those having 25,000 or more employees engaging in training 51% of the time.
Observation: We find that hope springs eternal among CHRO’s who believe that their team members will “figure it out” after they implement a new HR operating model. Given the multitude of separate interactions amongst the three pillars of HR on something as simple as goal setting, it seems shortsighted not to spend time clarifying who does what when for the largest HR processes.
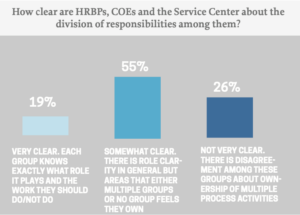
20. HRBP, COE, SERVICE CENTER
Finding: While not a terrible result, the fact that only 19% of organizations can say that the three pillars of HR are clear about how responsibilities are divided among them indicates there is room to grow. A quarter of companies are in disarray about the division of responsibilities and that finding holds for large companies as well.
Observation: Clarity on this question begins with a more precise definition of what an HRBP, a COE member and a service center employee is responsible for. While there will never be perfect clarity, it’s reasonable to expect that at least 1/3rd of companies would be clear about this division. This may be a great question for every CHRO to explore at their next HR leadership offsite meeting.
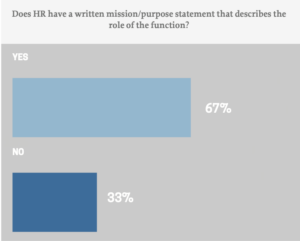
21. HR WRITTEN MISSION/PURPOSE
Finding: The role of the HR function is clear in 2/3 of responding companies.
Observation: It’s a pleasant surprise to see that the majority of responding HR organizations have an actual mission or purpose statement that describes their role. There appears to be room, however, to translate that mission or purpose into how HR operationalizes itself based on the responses to earlier questions.
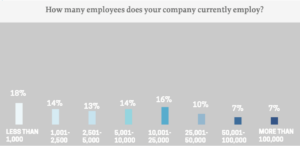
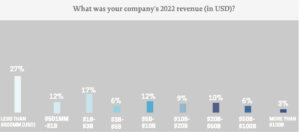
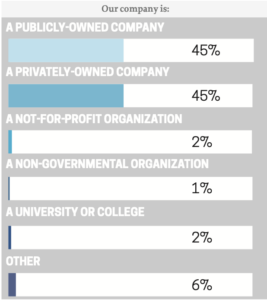
SURVEY DEMOGRAPHICS